

The Crosstown Crime Book: November


Understanding the state of crime in Los Angeles requires knowing not just the latest statistics, but how these figures compare with the recent and more distant past. Crosstown provides that information and context each month with the Crime Book, using publicly available Los Angeles Police Department data. Here is the situation in November.
Not as many murders
In 2021, the city of Los Angeles recorded 397 homicides, making it the deadliest year since 2007. Throughout much of 2022, nothing changed—there were 304 murders from Jan. 1–Oct. 1, the same number as in that timeframe last year.
In the last two months, however, the outlook has improved. The LAPD registered 25 homicides in November, down from 31 in the same month last year.
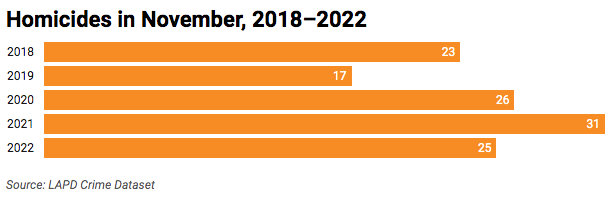
The count is also the second-lowest monthly total this year. In both July and August there were 44 murders.
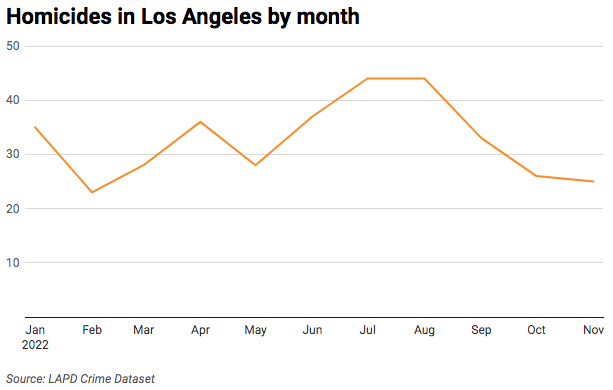
Through Dec. 10 the city experienced 362 homicides, 19 fewer than at that point last year, according to LAPD Compstat data. Although homicides remain well above the pre-pandemic pace, the recent downturn is being welcomed by public safety officials.
“We continue to see an improvement with fewer homicides and shooting victims versus the same period last year,” Chief of Police Michel Moore told the Los Angeles Police Commission on Dec. 13.
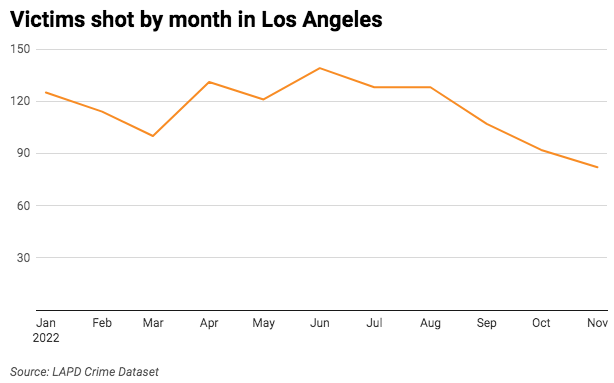
Last month the department registered 82 victims shot. The count has not been this low since April 2020.
Also declining are robberies involving guns. Last November there were 281 such incidents, and there was a flurry of news stories about violent follow-home robberies. That prompted the LAPD to create a task force focusing on such crimes.
[Get COVID-19, crime and other stats about where you live with the Crosstown Neighborhood Newsletter]
Whether due to the task force or other factors, a reversal is happening. The number of robberies involving guns in Los Angeles has declined each month since July, when there were 266 incidents. In November, 168 crimes were recorded.
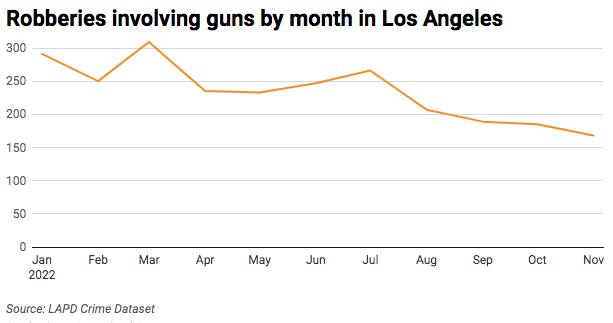
Downtown last month had 15 robberies involving a firearm, more than any other neighborhood in the city. There were nine incidents in Vermont-Slauson, the second-highest total, and seven in Florence.
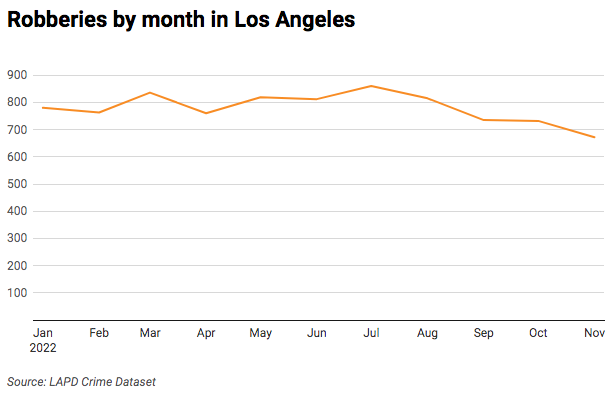
Overall robberies were also down dramatically last month. It was the first time below 700 in more than a year, and the lowest monthly total since the 670 reports in June 2021.
Property problem
Through Dec. 10, total violent crime in the city was 1.3% higher than at the same point last year. The situation with property crime is more unsettled. According to Compstat data, there have been 94,490 property crimes in the city, a 9.4% increase over the same timeframe last year.
There were 1,279 burglaries last month, the highest monthly total since June. It is also more than in any November in the last three years.
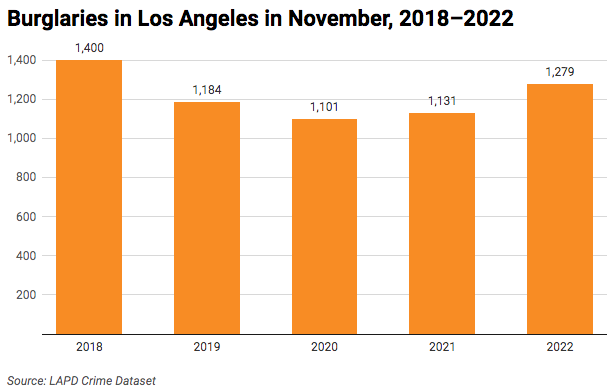
Downtown suffered more burglaries than any other community, with 79 last month. The next highest counts were in a pair of San Fernando Valley neighborhoods: Encino (43 reports) and Sherman Oaks (41).
Moore told the Police Commission that car break-ins are also on the rise, particularly in Downtown and the Northwest Valley.
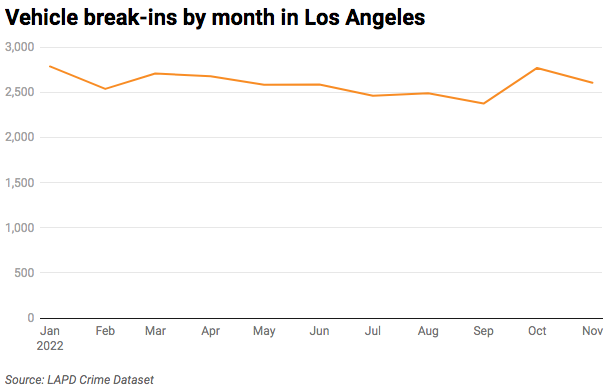
Each month from May through September, there were fewer than 2,600 car break-ins. In October, the number shot up to 2,768, and the count for November now stands at 2,604. It will likely rise further as late reports from the month are filed.
How we did it: We examined publicly available crime data from the Los Angeles Police Department from Jan. 1, 2018–Nov. 30, 2022. We also examined LAPD Compstat data. Learn more about our data here.
LAPD data only reflects crimes that are reported to the department, not how many crimes actually occurred. In making our calculations, we rely on the data the LAPD makes publicly available. LAPD may update past crime reports with new information, or recategorize past reports. Those revised reports do not always automatically become part of the public database.
Have questions about our data or want to know more? Write to us at askus@xtown.la.


