The Crosstown Crime Book: October

The Crosstown Crime Book uses data and historic context to present a picture of safety in the city. Each month we examine publicly available Los Angeles Police Department figures to determine whether there are more or fewer homicides, robberies, burglaries and other crimes than there were in recent months, or the same month in the past few years.
Here is how the situation looked in October.
Death toll
The city of Los Angeles remains on pace for a disturbingly high number of murders. The 343 homicide victims through Nov. 19, according to LAPD Compstat data, is already more than any full calendar year from 2010–2019 (the low was the 251 killings in 2013).
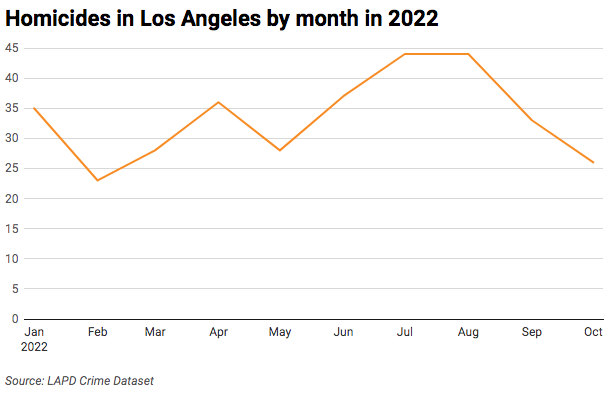
That said, the 26 murders in October was down significantly from previous months. It marks the second lowest monthly total in 2022, trailing only the 23 recorded in February.
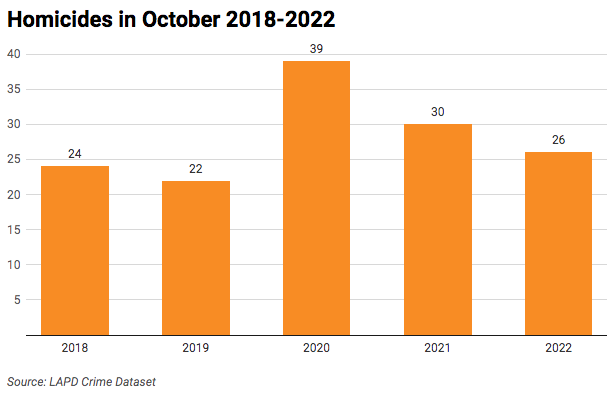
It is also measurably below the same month in the last two years.
The decline has been welcomed by the LAPD, with Police Chief Michel Moore telling the civilian Los Angeles Police Commission this month, “We’ve seen a continued reduction in our homicide and shooting victims.” Yet Moore quickly noted that any improvement is measured, stating, “We are still trying to achieve pre-pandemic levels, which were much lower.
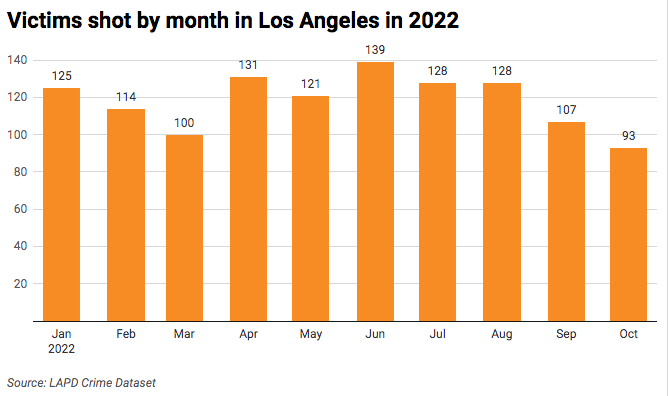
The 93 victims shot in October, according to LAPD data, is the lowest monthly total in more than two years. It is 33% below the 139 people struck by gunfire in the city in June.
There have been 95 people shot in Downtown this year, more than any other neighborhood in Los Angeles. The next most-impacted community is Boyle Heights (75 reports), followed by Florence (54).
[Get COVID-19, crime and other stats about where you live with the Crosstown Neighborhood Newsletter]
‘Ghost gun’ problem
Los Angeles, like many cities across the country, has experienced a sharp uptick in gun violence since the pandemic began, and Moore has frequently decried a rise in “ghost guns,” firearms that are untraceable and lack a serial number (some are manufactured on 3D printers). At weekly Police Commission meetings, Moore has said these weapons have contributed to a COVID-era rise in robberies involving guns.
”We have a 45% increase in robberies involving a firearm from 2019, yet overall robberies in the city of Los Angeles are down in that same period by more than 3%,” Moore stated at the Nov. 1 meeting.
As with victims shot, the number of robberies involving a firearm last month fell to its lowest level this year. There were 185 incidents in October; the last time there were fewer in a single month was July 2021.
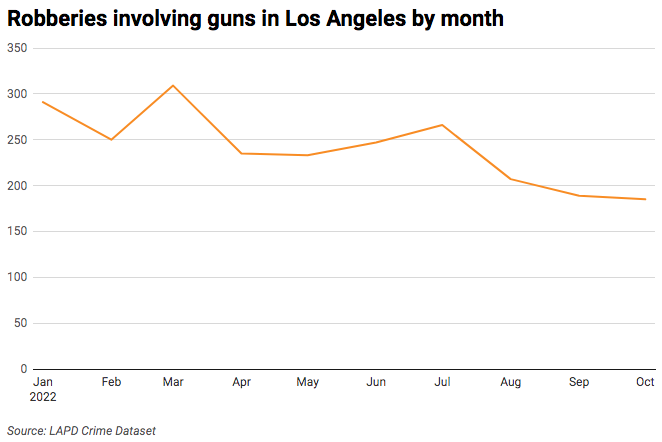
Still, last month’s count is above the 164 in the same month in 2018.

Taking things
Through Nov. 19, according to Compstat data, there had been 87,819 property crimes in the city. That is 9.3% more than at the same time in 2021.
Burglaries are up over 12% compared with last year. Still, October brought a ray of hope: The 1,120 burglaries was again the lowest monthly figure of 2022. The peak was the 1,343 incidents in May.
Dense Downtown continues to experience more burglaries than any other neighborhood, with 751 in the first 10 months of 2022. That is nearly double the second most-impacted community, Koreatown, where there were 392 burglaries from Jan. 1–Oct. 31. In Sherman Oaks there were 378 reports.
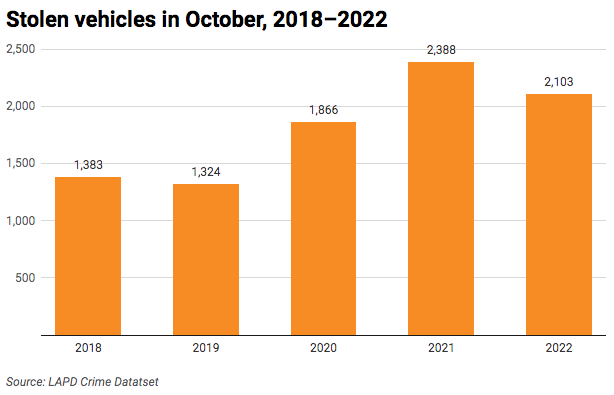
The situation with stolen vehicles in the city is mixed. October 2021 brought 2,388 car theft reports, the highest monthly total in at least a decade. The 2,103 rides that went missing last month is an 11.9% decline from that peak.
Still, with more than 2,000 reports nearly every month, car theft remains at an epidemic level when compared with the time before the pandemic. October in both 2018 and 2019 brought fewer than 1,400 car thefts.
Downtown gets hit more than any other neighborhood; it saw 1,154 car-theft reports through Oct. 31. The communities with the next-highest totals were Boyle Heights (751 reports) and Westlake (661).
How we did it: We examined publicly available crime data from the Los Angeles Police Department from Jan. 1, 2018–Oct. 31, 2022. We also examined LAPD Compstat data. Learn more about our data here.
LAPD data only reflects crimes that are reported to the department, not how many crimes actually occurred. In making our calculations, we rely on the data the LAPD makes publicly available. LAPD may update past crime reports with new information, or recategorize past reports. Those revised reports do not always automatically become part of the public database.
Have questions about our data or want to know more? Write to us at askus@xtown.la.


