

A record year for dead animal pick-up calls in Los Angeles


In 2022, the city of Los Angeles registered more burglaries and car thefts than the previous year. But those were not the only discomfiting increases: City crews responded to a record number of calls to pick up deceased animals.
In the just-concluded year, 27,828 requests for dead-animal pick-up were made to the city’s free MyLA311 system. That is the highest count since the city began making this data publicly available in 2015, and is an 8.1% increase over the 25,736 calls in 2021.
There were 2,697 requests in June, the highest monthly total. That slightly exceeded the 2,685 calls in October, according to publicly available MyLA311 data.
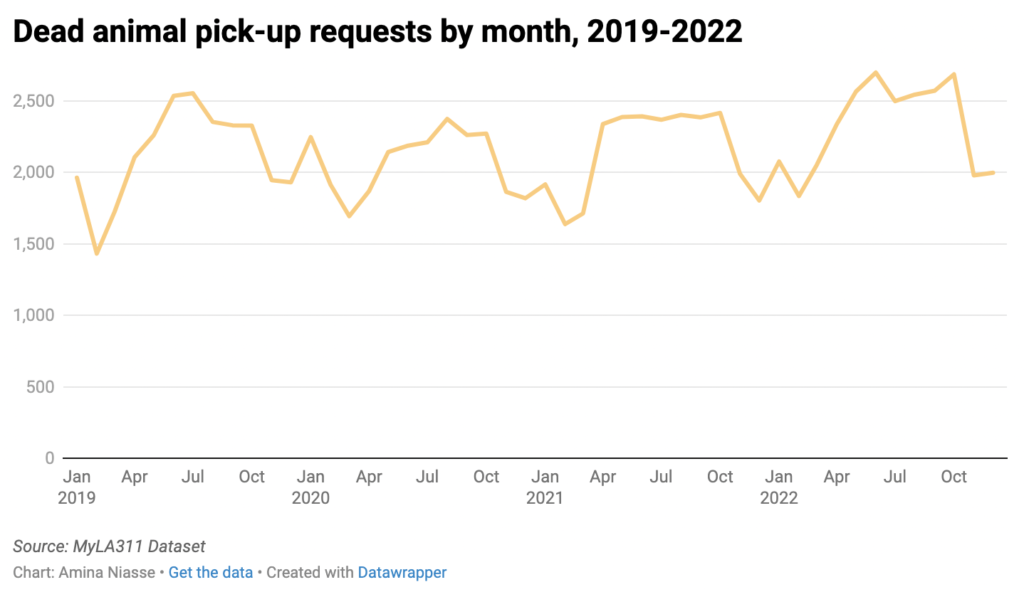
Pickup figures coincide with seasonal changes and animal birth cycles. The L.A. Sanitation and Environment bureau typically sees calls spike in April and May, and the number remains elevated until October. Some requests are for beloved pets, while other times there are calls to remove dogs, cats, possums or other animals hit by cars or that otherwise died in public areas. Dead animals, with the exception of cows and horses, are collected for free by the city.
The period from April to October saw an average of 2,555 calls each month.
“There are what we call seasons, like kitten season in the spring, where more kittens are born,” said Marcia Mayeda, director of the Los Angeles County Department of Animal Care and Control. “From about March and April through September, there are more animals born.”
In the spring, animals also frequently run outside, leading to a higher rate of vulnerable creatures, according to Mayeda.
“It’s nicer weather so they’re more likely to be running loose, not stay hunkered down,” said Mayeda. “Also, kids are home from school. There’s more likelihood for there to be a door or gate left open and animals to get out.”
As was the case in previous years, the nadir for 2022 occurred in February, when 1,834 pick-up requests were made.
[Get COVID-19, crime and other stats about where you live with the Crosstown Neighborhood Newsletter]
Calls in the Valley
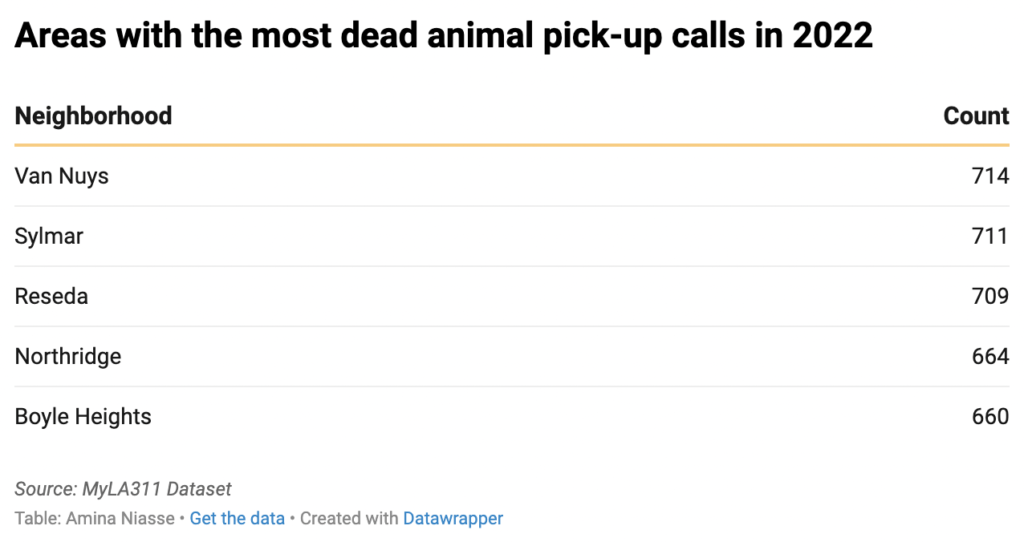
In 2022, Van Nuys recorded 714 dead animal pick-up requests, more than any neighborhood in the city of Los Angeles. Three other San Fernando Valley communities also ranked in the top five.
Mayeda’s office services unincorporated neighborhoods in Los Angeles County, and not the ones where city crews operate. She noted that communities with mountainous landscapes and foothills see the most wild animals at risk.
That’s just one way the department has been busy recently.
“There has been a lot of use of our department’s intervention services for people who are having difficulty keeping their pets,” said Mayeda, pointing to economic stresses tied to COVID-19 and inflation. “People are having a harder time paying for things.”
While many people unable to afford caring for their pets surrender them to shelters, some release their animals to roam in order to avoid costs such as shelters’ intake fees, according to Susan Friend LeTourneur, the founder of Golden Years Dog Sanctuary, an animal rescue service.
Also potentially contributing to the rise in dead animal pick-ups is the Citywide Cat Program. Approved by the city in 2020 and implemented last year, it involves catching and then neutering or spaying stray or feral felines—there are an estimated 960,000 of them in the city, according to the L.A. Animal Service department. Then, they are released back to the outdoors, rather than put in shelters.
“When people would find stray cats,” said Friend LeTourneur, “they’d tell them to put the cat back where it belonged.”
These roaming animals are often vulnerable to predators, according to Friend LeTourneur.
How we did it: We examined publicly available data from the City of Los Angeles MyLA311. System from Jan. 1, 2015–Dec. 31, 2022. For neighborhood boundaries, we rely on the borders defined by the Los Angeles Times. Learn more about our data here.
Want to know more about how your neighborhood fares? Or just interested in our data? Email us at askus@xtown.la.


