

5 things to know about COVID-19 this week


The COVID-19 situation in Los Angeles County continues to improve, but history has shown that things can quickly change. Crosstown each week analyzes the latest data and metrics. Here is everything you need to know.
1) Triple-digit figures
The number of new COVID-19 cases continues to decline. From Jan. 18–24, the Los Angeles County Department of Public Health reported 7,263 infections. That marks a 19.9% decrease from the week prior.

On Sunday, the seven-day case average in Los Angeles County dipped to 984, the first time in triple digits since Nov. 1. On Tuesday, the average climbed back up to 1,038.
2) Leveling off
The winter holidays are behind us, but good news is still in the air. On Jan. 20, Los Angeles County’s “community level,” a ranking determined by the Centers for Disease Control and Prevention, dropped to “low.” This is the first time the region has hit the level since November. Previously the county was in the medium community level.
The ranking reflects the strain the pandemic is placing on the regional healthcare system, and is determined by the number of new cases, new COVID-19 hospital admissions, and the proportion of hospital beds occupied by coronavirus patients. It can all be tracked on the Department of Public Health COVID-19 Response Plan dashboard.
[Get COVID-19, crime and other stats about where you live with the Crosstown Neighborhood Newsletter]
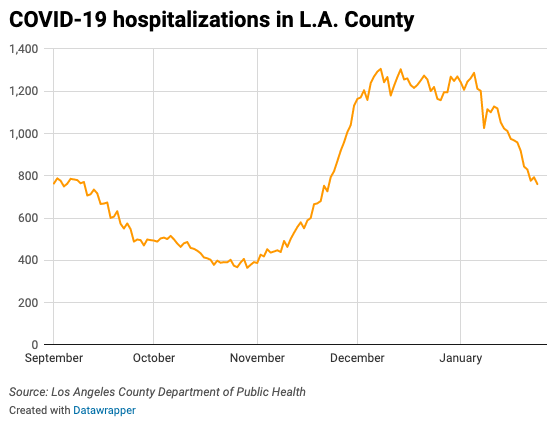
The seven-day average case rate has dropped to 71 infections per 100,000 people, and seven-day hospital admissions per 100,000 residents is down to 9.5.
3) Give it a boost
The pace of vaccinations remains sluggish, with fewer than 8,000 shots administered in the entire month of December. According to the Los Angeles County COVID-19 Vaccine Dashboard, 80.9% of all Angelenos have received at least one dose. An estimated 73% of individuals are fully vaccinated.
Approximately 1.6 million county residents ages 5 and older have received the updated bivalent booster. This represents just 16.5% of the county population.
4) Policing COVID-19
Each week, LAPD Chief Michael Moore details crime statistics in the city, when he appears before the Los Angeles Police Commission. He also shares data about COVID-19 infections in the department that contains approximately 12,000 sworn and civilian staff members.
In the meeting on Tuesday, Moore stated that, similar to society at large, overall COVID infections continue to slow in the LAPD. During the week closing Jan. 21, there were 31 new cases. He said 30 of them involved vaccinated personnel.
He also said 73 department staff are recovering at home, down from 148 two weeks prior. Moore added that the department continues “to have 14 long COVID cases with no hospitalizations,” and that the average COVID patient is off the job for nine days.
Moore did not say how many total COVID infections have been detected in the department, but last September he said the level was over 7,000 since the start of the pandemic.
5) Coast to coast
New Omicron variants have been popping up around the United States, including New York City and Los Angeles County. How do the areas measure up when it comes to COVID-19 infections?
Los Angeles County has 10.04 million residents, and the region is averaging approximately 1,000 cases per day over the past week. New York City has 8.38 million inhabitants, and according to the New York Times is currently averaging nearly 2,300 cases a day.
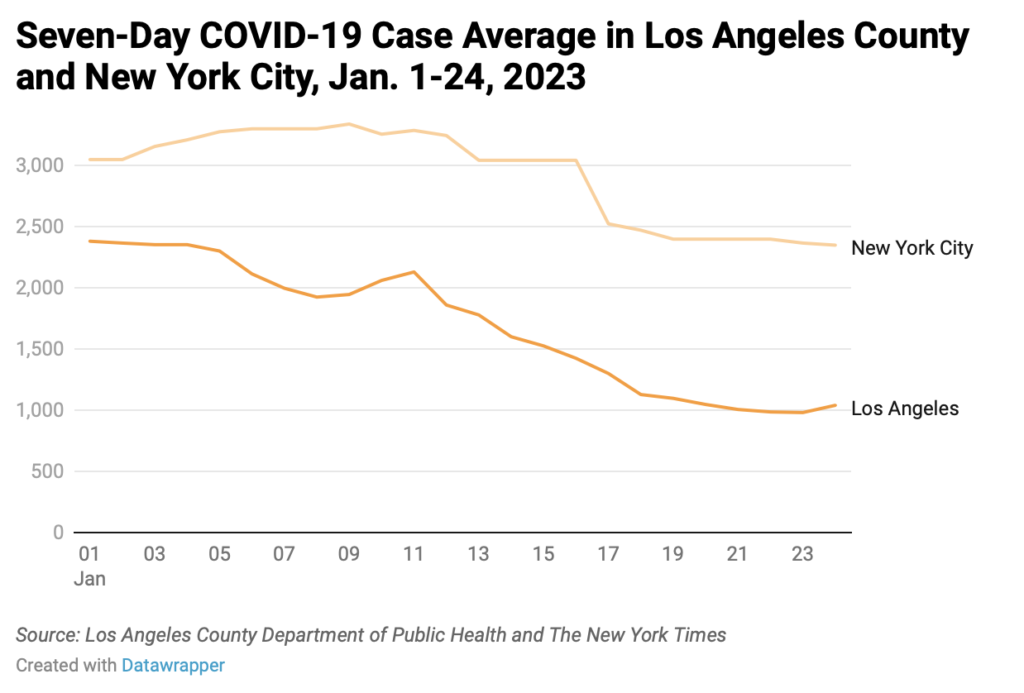
This indicates that the situation is slightly worse in New York City. Of course, it is difficult to do a definitive comparison, as many cases identified through home tests are never reported to health authorities on either coast.
How we did it: We analyzed coronavirus data related to new cases, deaths, hospitalizations and vaccinations provided by the Los Angeles County Department of Public Health, as well as data from the California Department of Public Health.
Interested in our data? Check out the Crosstown coronavirus interactive map or email askus@xtown.la.


