

The Month in COVID: January


COVID-19 metrics in Los Angeles County surged in January of 2021 and 2022. This year, the situation could not be more different. Here is Crosstown’s monthly rundown of the latest figures.
Cases
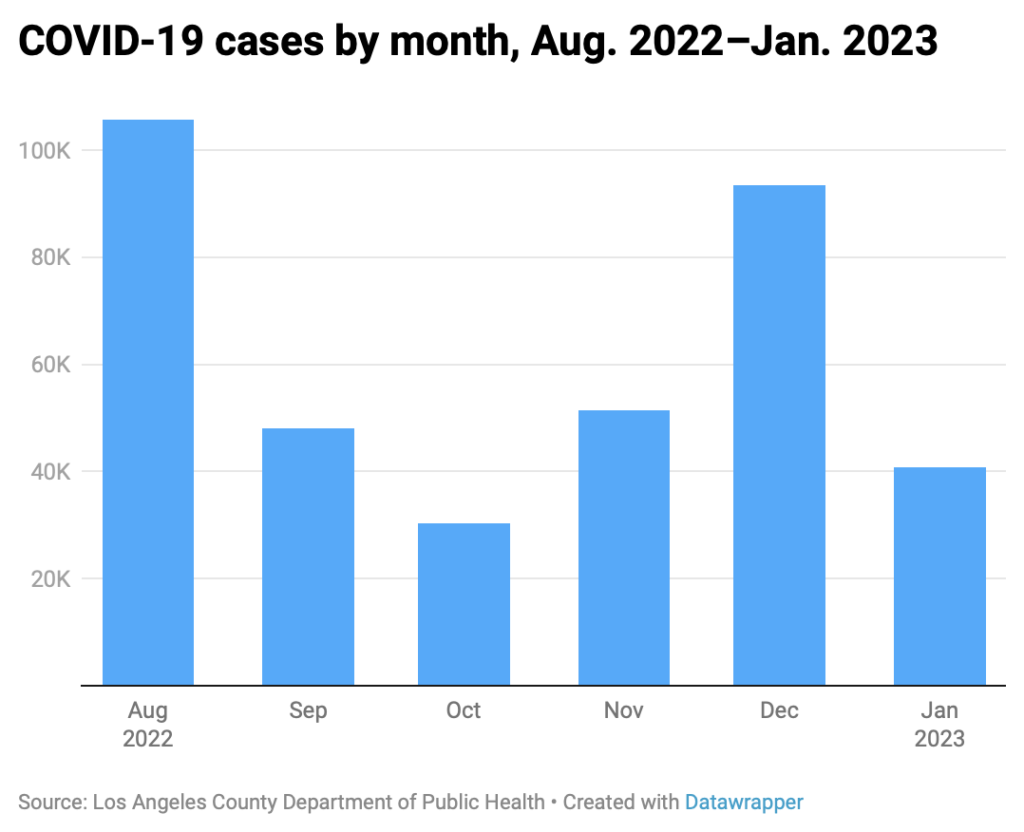
Just two months ago, it looked like the region was in for another coronavirus wave. The case count in November more than doubled from the previous month. Many expected a repeat of the past, with a Thanksgiving spike being exacerbated by crowds that gathered indoors over the winter holidays, and hospitals filling in January.
Instead, the Los Angeles County Department of Public Health recorded 40,619 total cases in January, marking a 56.5% decrease from the month before. The daily peak occurred on Jan. 5, with 3,602 cases. The low was the 383 cases reported on Jan. 30.
Compare this with January 2022, when the Omicron variant raced across the landscape. Daily case counts skyrocketed, peaking at 45,584 on Jan. 9—yes, there were more infections identified on that one day than in the entirety of January 2023.
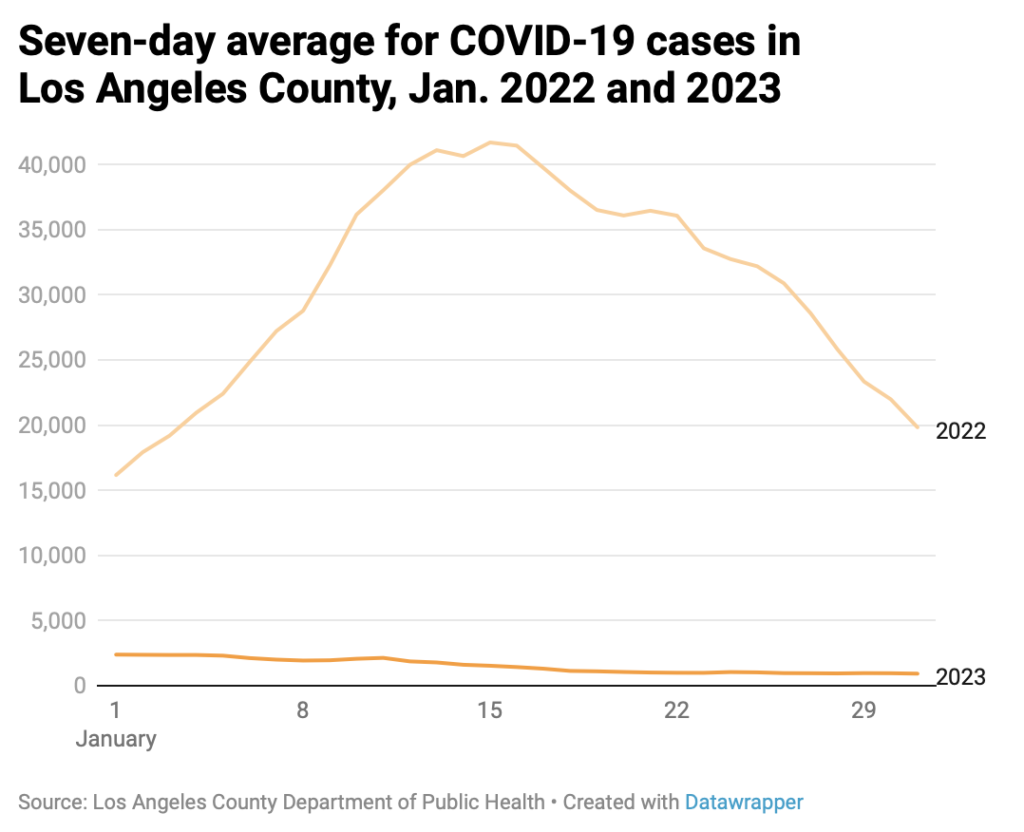
In the first few days of February, average cases have been sitting just above 1,000 per day. That’s a bit of an increase, but still historically low.
Remember, these are just cases reported to county health officials, and the actual number of infections is likely higher. Many Angelenos identify COVID-19 through at-home tests, though few people report them if symptoms are minor.
[Get COVID-19, crime and other stats about where you live with the Crosstown Neighborhood Newsletter]
Positivity rate and hospitalizations
At the beginning of the month, the positivity rate stood at 15%. The peak was the 16.1% recorded on Jan. 3. This was the highest level since late July.

Then the figure declined, and throughout the rest of the month, the positivity rate sat below 10%. The low was the 4% on Jan. 23. On Jan. 31, the rate stood at 5.6%.
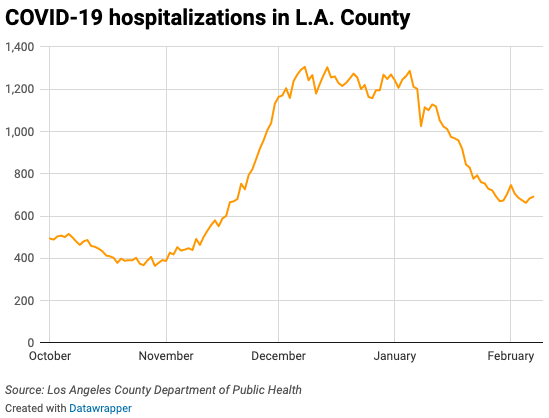
The situation was similar with hospitalizations. On Jan. 5, 1,287 people in L.A. County were hospitalized with COVID-19. By the end of January the figure was just below 700. A Department of Public Health analysis determined that in the final months of 2022, approximately half of the COVID patients in medical facilities were there because of illnesses related to contracting the coronavirus, and about half had “incidental” cases.
Last month, the average number of hospitalizations per day was 968. That is a 21.4% decrease from more than 1,200 in December.
Taking shots
The bivalent booster has been available in Los Angeles County since last September. Health officials are still urging residents to further protect themselves with another shot, but many people are holding back.
According to the Department of Public Health, only 6,068 Angelenos received a COVID vaccine dose in January, the lowest monthly count since shots were widely rolled out. The peak for vaccinations occurred in March 2021, when vaccines were still new and more than 1.7 million residents received a jab in the arm.
While most metrics in the county are improving, health officials insist that COVID-19 is still a concern. Even if someone contracts the virus, the protections from a round of shots or the bivalent booster can prevent severe symptoms or death.
Across the county, just 17% of eligible residents have received the updated booster.
Deaths
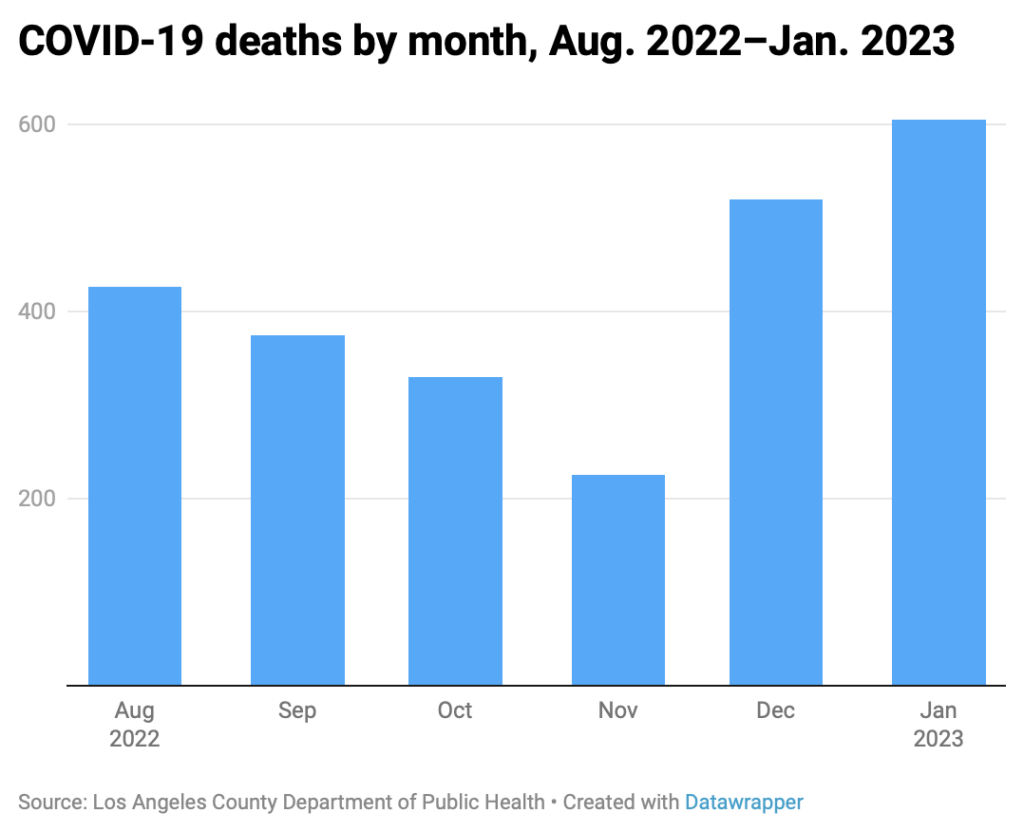
For all the progress seen in January, there was a grim reminder of how serious COVID-19 can be: Deaths remained stubbornly high.
Fatalities are often a lagging indicator, decreasing weeks or months after other key figures have started declining. That was the case as an estimated 605 county residents died of COVID-19 in January. This marks a 16.6% increase from the previous month.
At the beginning of the month, the seven-day average for fatalities related to COVID-19 was 19. Throughout most of January, it hovered around 20. On Jan. 31, average deaths fell to 17, the lowest figure of the month.
On Jan. 17, Los Angeles County surpassed 35,000 deaths since the start of the pandemic. At the close of the month, the Department of Public Health reported 35,294 total deaths due to COVID-19.
How we did it: We analyzed coronavirus data related to new cases, deaths, hospitalizations and vaccinations provided by the Los Angeles County Department of Public Health.
Interested in our data? Check out the Crosstown coronavirus interactive map or email askus@xtown.la.


