

5 things to know about COVID-19 this week


![]()
The coronavirus situation is constantly changing. That’s why every week Crosstown reports on the latest COVID-19 developments in Los Angeles County. Here is what we know.
1) A new dominant variant
On Feb. 10, the Los Angeles County Department of Public Health announced that a variant known as XBB.1.5 is now the dominant strain in the area. It accounted for 32.8% of the infections sequenced in the week ending Jan. 21 (the most recent week for which reporting is available).
The spread is even wider beyond Los Angeles. According to the Centers for Disease Control and Prevention, 56.9% of the cases in the Western U.S. (in the CDC’s Region 9, which includes California, Arizona, Hawaii and other states) are now XBB.1.5. One month ago, only 8% of cases in the region were the new strain.
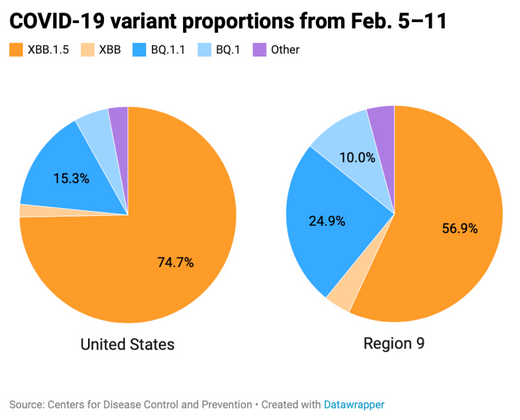
The subvariant was first identified in New York, and has been dominant in the Northeast for more than a month. Nearly three-quarters of the cases nationwide are designated as XBB.1.5.
2) Cases stabilize
Even with the prevalence of the new variant, average COVID-19 cases have remained steady for the last month.
From Feb. 8–14, the County Department of Public Health reported 7,296 new cases. That marks a 5.2% decrease from the week before. Weekly tallies have remained below 10,000 for the past five weeks.
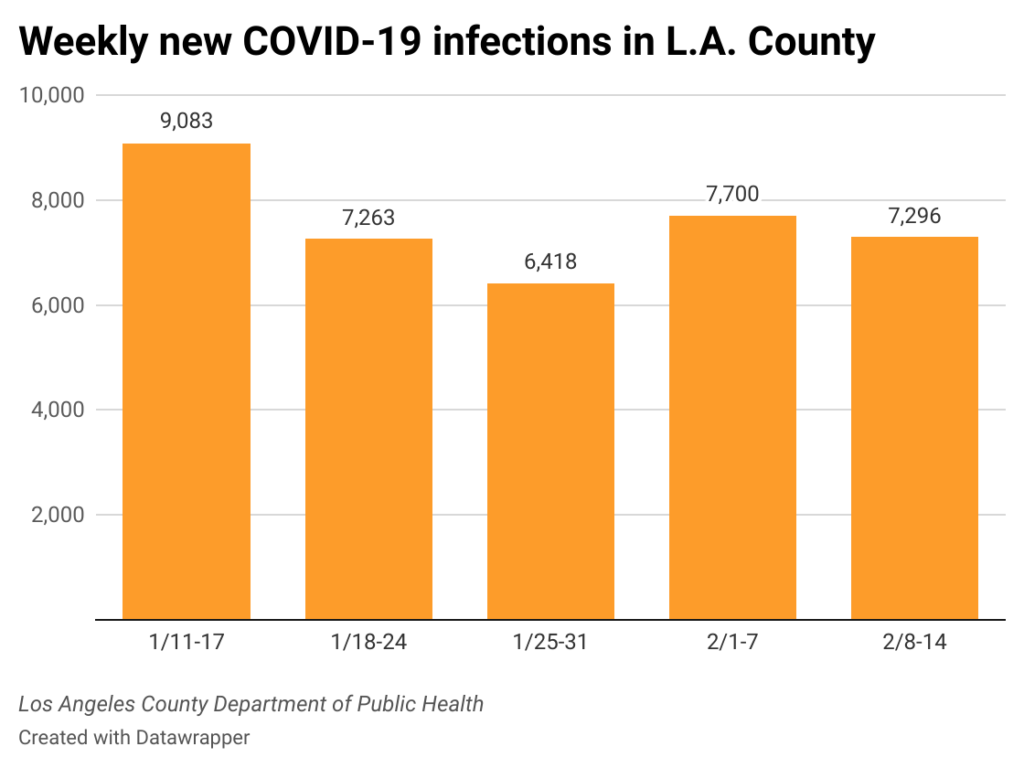
On Tuesday, the seven-day average of daily cases in Los Angeles County was 1,042. Last January, the seven-day average was between 20,000 and 40,000 cases, though the count dropped dramatically in February as the Omicron surge waned.
3) Testing restrictions relax
As the overall situation improves, local governments are easing off their coronavirus protocols. On Tuesday, the City Council unanimously voted to end mandatory COVID-19 testing for unvaccinated city employees.
Although the testing requirement is ending, a vaccination mandate for municipal workers stands.The council resolution also states that the city will reimburse employees for any time or money spent adhering to previous testing requirements.
[Get COVID-19, crime and other stats about where you live with the Crosstown Neighborhood Newsletter]
4) Fatalities and hospitalizations remain consistent
It seems the word of the week is “stabilize.” As the number of new cases remains steady, so do two other key metrics.
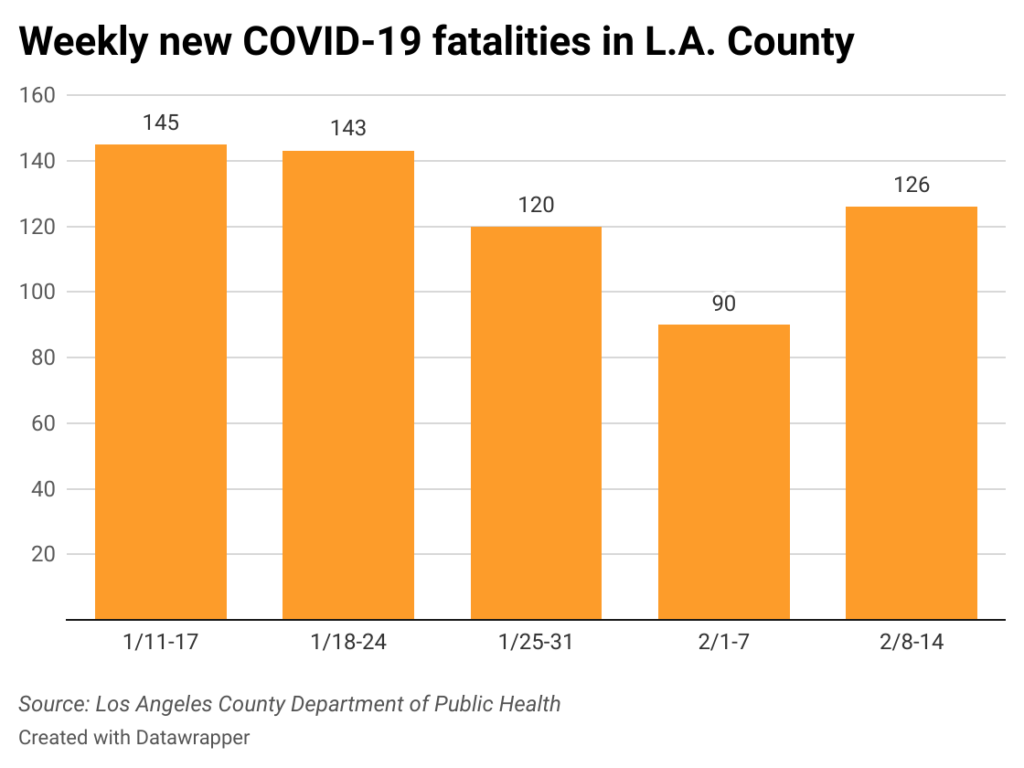
Since Jan. 25, the seven-day average of COVID-19 fatalities in the county has remained below 20. On Tuesday, the average stood at 18 deaths.
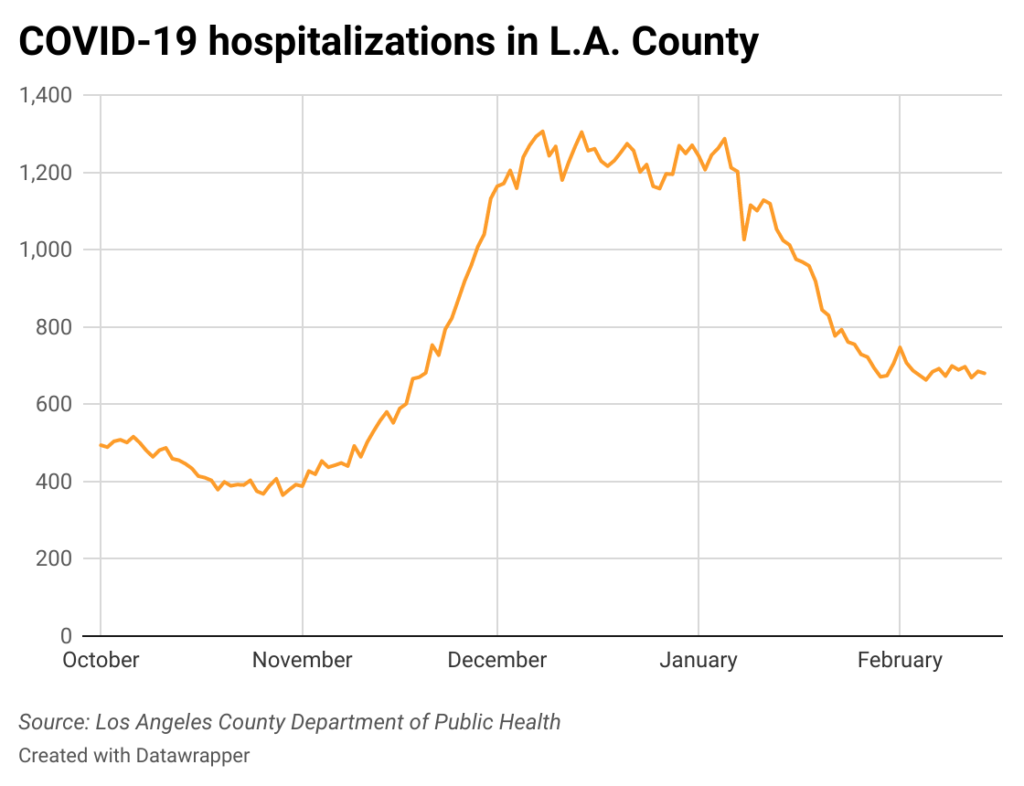
Hospitalizations are also in a holding pattern, leveling off at around 700 for the past two weeks. On Tuesday, there were 680 coronavirus patients in area medical institutions. This marks a moderate 3.5% decrease from two weeks prior.
5) County vs. California
We know the coronavirus situation in Los Angeles County. How does it compare with the rest of the state?
With 9.83 million residents, L.A. County accounts for about 25% of California’s population of 39.24 million people. Since the beginning of the pandemic, the county has identified 3.47 million COVID-19 cases, making up 31% of the state’s total. Across California, there have been 11.08 million cases since March 2020.
According to the state’s COVID-19 dashboard, California had a seven-day average of 6.6 cases per 100,000 people at the beginning of the month. Los Angeles County was slightly higher, at 7.4 cases per 100,000 inhabitants.
It’s possible that figures are higher in L.A. than other parts of the state because there is better tracking and testing in the county. Or maybe, dense neighborhoods and more activity that brings people together are making a greater number of Angelenos sick.
How we did it: We analyzed coronavirus data related to new cases, deaths, hospitalizations and vaccinations provided by the Los Angeles County Department of Public Health, as well as data from the California Department of Public Health.
Interested in our data? Check out the Crosstown coronavirus interactive map or email askus@xtown.la.


