

5 things to know about COVID-19 this week


Even if you barely pay attention to it, the pandemic is still present in Los Angeles. Each week, Crosstown reports on the state of COVID-19. Here is the latest.
1) Cases stay stable
Although the new variant XBB.1.5 has become dominant in the region, COVID-19 cases remain stable.
From Feb. 15–21, the Los Angeles County Department of Public Health reported 6,200 new cases. This marks a 15% drop from the previous week. Notably, this is also the lowest weekly tally since April 2022.
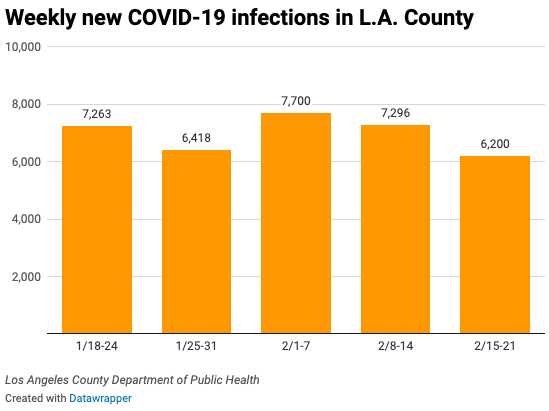
This week, the seven-day average of daily cases dipped below 900. On Tuesday, the average stood at 886.
2) Benefits of the booster
Last Friday, the Department of Public Health released new data demonstrating—once again—the benefits of the bivalent booster. The shot became available last fall and protects against both the original and Omicron coronavirus strains.
In particular, older adults who received the latest shot were found to be significantly less likely to be hospitalized or die due to COVID-19. This is in comparison to people who are either unvaccinated, or who have not yet received the bivalent booster.
[Get COVID-19, crime and other stats about where you live with the Crosstown Neighborhood Newsletter]
Specifically, unvaccinated adults 80 and older were more than three times as likely to be hospitalized, and more than five-and-a-half times as likely to die. The trend is even more pronounced in the 65-79 age group: Unvaccinated people were 12 times more likely to be hospitalized, and almost 16 times more likely to die.
3) Hospitalizations also steady
The positivity rate and hospitalizations are also key indicators of COVID-19 in the community. Both are holding steady.
For much of February, the test positivity rate has hovered around the 5%-6% range. On Wednesday the rate was 6.8%.
The lowest positivity rate in 2023 was the 4% reported on Jan. 23.
Hospitalizations are also steady, and have been in the vicinity of 700 for the past month. On Wednesday, there were 698 patients in area hospitals.
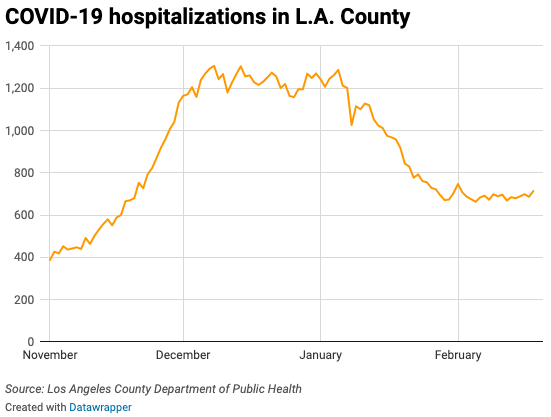
At the worst point of the pandemic, in January 2021, there were more than 8,000 people hospitalized with COVID-19, putting a major strain on the regional healthcare system.
4) Too many deaths
Even as other figures are stabilizing, dozens of Angelenos continue to pass away each week due to complications from COVD-19.
From Feb. 15–21, there were 117 fatalities in the county. That is nine fewer deaths than the previous week.
The number of coronavirus-related fatalities this winter has been well above previous months. In November, 225 deaths were reported in the county. As of Tuesday, the February total was already at 333.
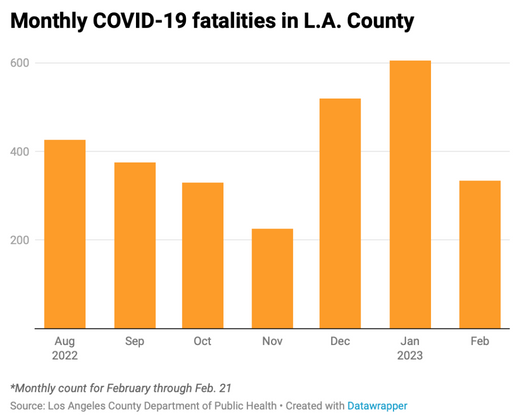
Since the beginning of the pandemic, more than 35,500 people in Los Angeles County have passed away from COVID-19.
5) Situation on the streets
The pandemic continues to impact people experiencing homelessness. The Department of Public Health regularly reports on the state of COVID-19 in this community.
In the most recent reporting period, with data through Tuesday, there were 92 cases among the unhoused. According to the Department of Public Health, 62 of these were first infections, and 30 were presumed reinfections. Over the most recent seven-day period, there was an average of 11 cases a day among people experiencing homelessness.
Since the beginning of the pandemic, there have been 24,137 COVID-19 cases and 377 deaths among people experiencing homelessness in Los Angeles County.
Throughout the pandemic, an estimated 64% of the cases in the unhoused community have involved men. Approximately 60% of all those infected were sheltered, while 23% were designated as unsheltered. The housing situation was unclear in 17% of cases.
How we did it: We analyzed coronavirus data related to new cases, deaths, hospitalizations and vaccinations provided by the Los Angeles County Department of Public Health, as well as data from the California Department of Public Health.
Interested in our data? Check out the Crosstown coronavirus interactive map or email askus@xtown.la.


