

The Crosstown Crime Book: June 2023


With the Crime Book, Crosstown examines monthly statistics and trends in criminal activity, using publicly available Los Angeles Police Department data. Here is how things looked in June.
In the summer of 2022, the Los Angeles mayor’s race put crime on the front burner. For months Karen Bass and Rick Caruso sought to convince voters that each had the best plan for public safety.
Crime remains a concern in 2023, but the narrative has changed. According to LAPD Compstat figures, violent crime in the first six months of the year is down 10.7% from the same period last year.
[Get crime, housing and other stats about where you live with the Crosstown Neighborhood Newsletter]
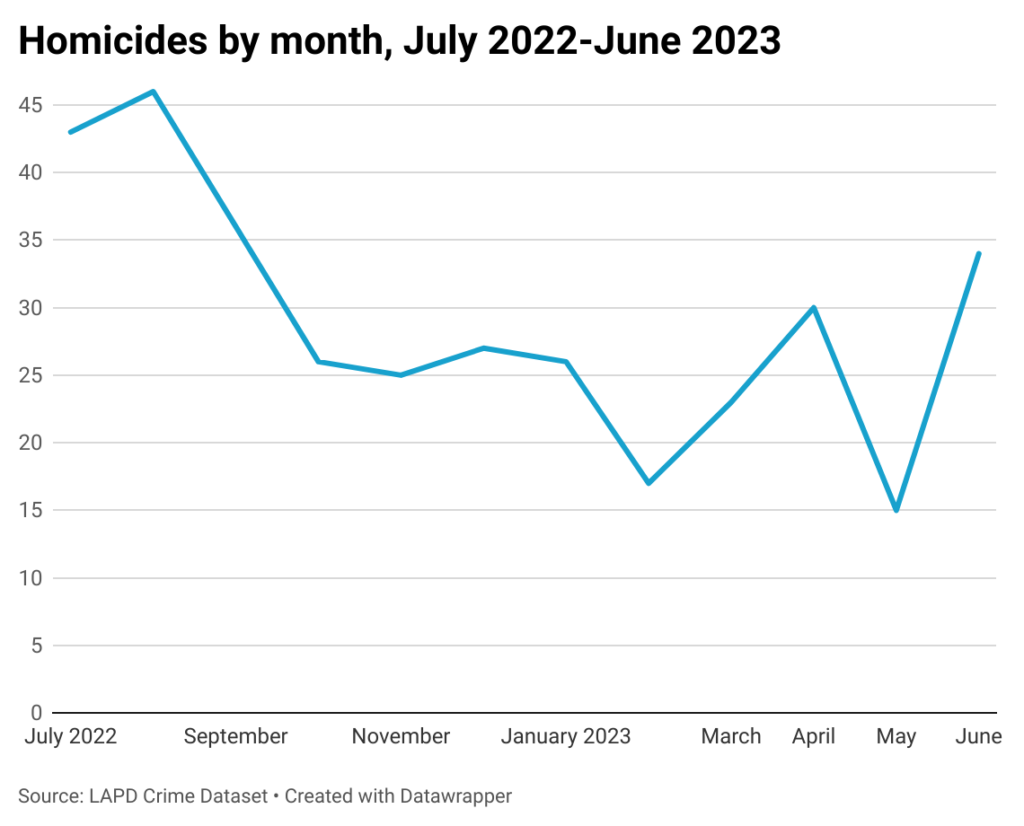
That is led by a dramatic drop in homicides. As Crosstown recently reported, the 145 murders in the city from Jan. 1–June 30 represents a 21.6% decrease from the same period last year.
However, not all indicators are positive. There were 34 murders in June, marking the highest monthly count since last September. It was more than twice the total in May.
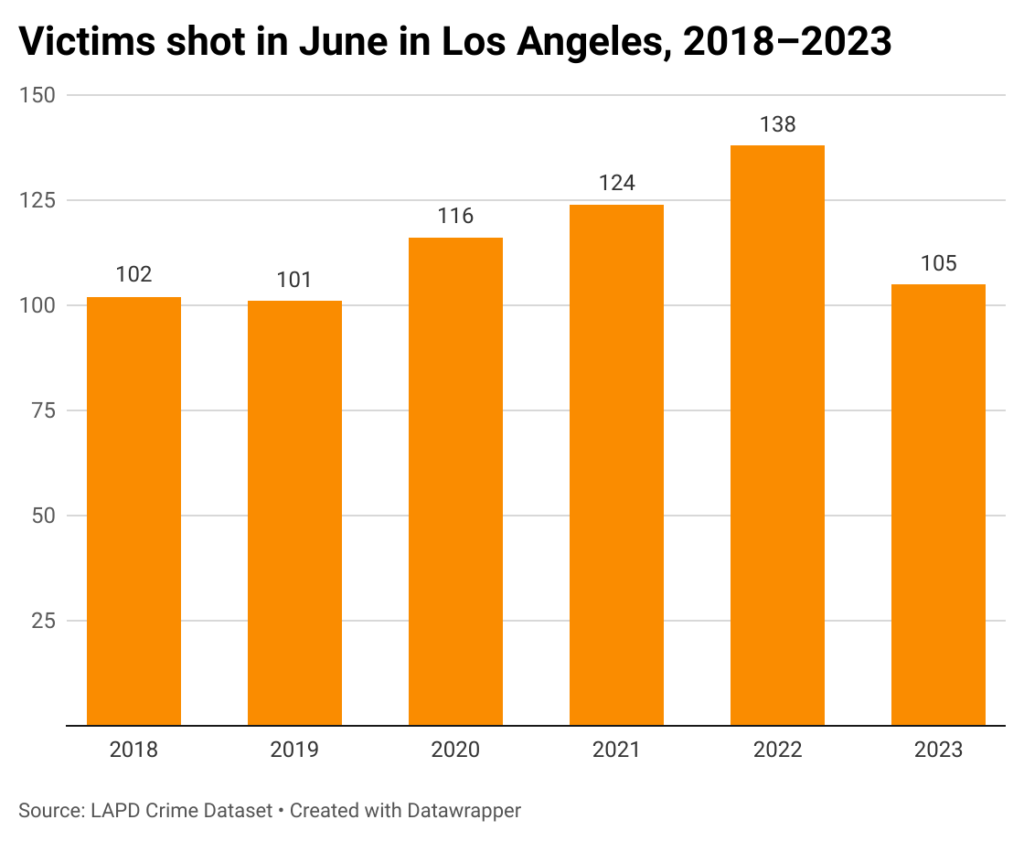
Gun violence is also down after spiking during the pandemic. According to police data, 105 people were shot in June.
Again, the news is mixed. In seven of the previous eight months, there were fewer than 100 gunshot victims. So June represents an increase.
However, the count in June in each of the three previous years was above 115 shooting victims.
There were 16 people struck by gunfire in Downtown in June, more than any other neighborhood in the city. The next-highest count was the seven gunshot victims in Vermont Vista.
Comparisons to last year tell only part of the story. LAPD Chief Michel Moore regularly looks at statistics from before COVID-19, describing 2019 as a “waterline.” Across the country, the pandemic brought increases in many types of crime, including incidents involving guns.
At the June 27 meeting of the Los Angeles Police Commission, Moore pointed to a discrepancy when year-to-date robbery figures are compared with those of four years ago
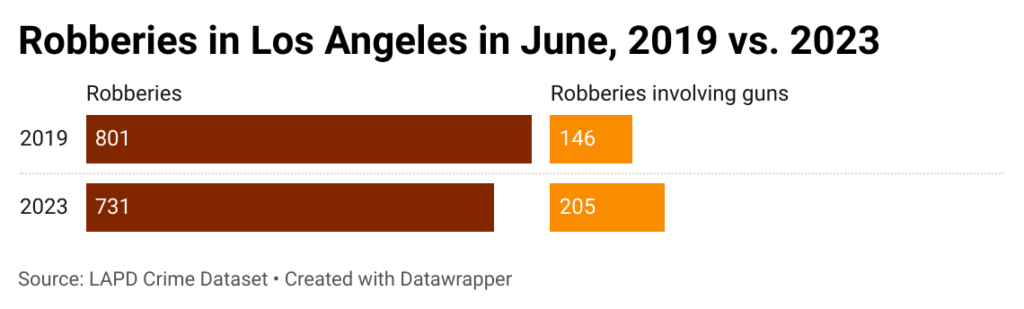
“Robberies in the city of Los Angeles compared to 2019 are actually down 16.6%,” Moore stated. “That’s a substantial reduction. However, robberies involving firearms for that same period are up 11%.”
The difference in incidents involving firearms in June of of 2019 and 2023 is even more pronounced.
Stealing from cars and stores
There is some variation in property crime statistics. Car break-ins, the most common crime in the city, are down 5.4% in the first half of the year compared with 2022. This is the case even after January brought 3,143 reports, which was the highest monthly total in at least a decade.
Figures have fallen every month since. In June the LAPD tabulated 2,164 car break-ins (the number will rise, as there is often a lag in reporting vehicle break-ins).

While fewer items are disappearing from vehicles, incidents of what the LAPD identifies as personal/other theft in the first half of the year are up 14.8% over 2022 levels, according to Compstat data.
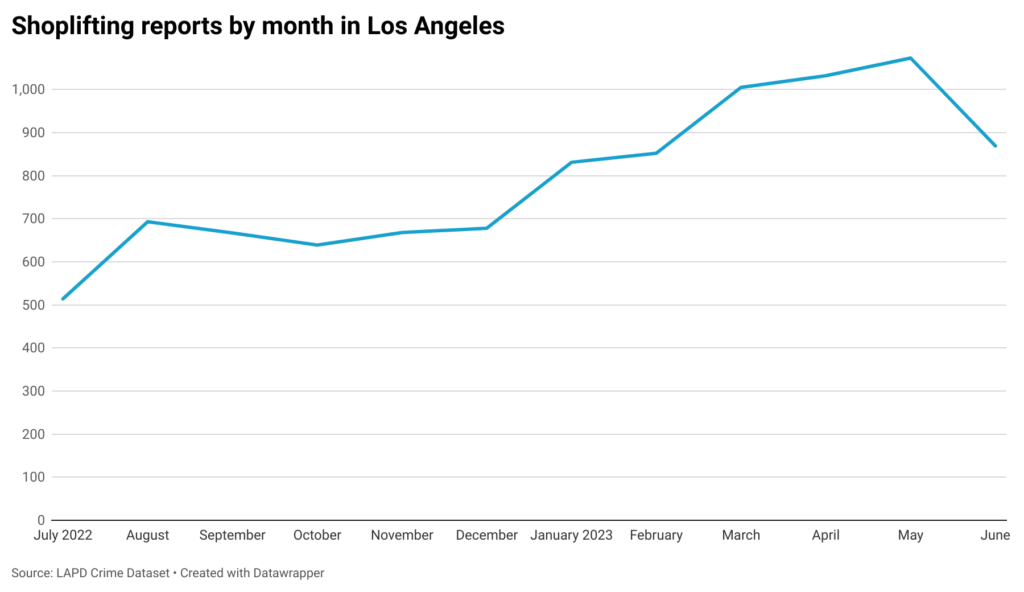
That is driven in part by soaring thefts from stores. In the second half of 2022, there were never more than 700 shoplifting reports in a single month. The count in June was 869, and the three months before that each brought more than 1,000 monthly incidents.
Canoga Park, home to a mall with more than 200 stores, was the site of 63 shoplifting reports in June, more than any other neighborhood. The second-highest count was the 51 incidents in Westchester.
Vehicle thefts, which reached record levels after the onset of the pandemic, have plateaued, though they remain well above counts before COVID. There were 1,938 cars stolen in June, according to LAPD data. While that is fewer than the same month last year, it is 63% higher than the figure in June 2019.

Traffic-heavy Downtown continues to get hit more than any other neighborhood. There were 120 stolen vehicle reports in June. The second-highest count was the 67 in Westlake.
How we did it: We examined publicly available crime data from the Los Angeles Police Department from June 1, 2018–June 30, 2023. We also examined LAPD Compstat data. Learn more about our data here.
LAPD data only reflects crimes that are reported to the department, not how many crimes actually occurred. In making our calculations, we rely on the data the LAPD makes publicly available. LAPD may update past crime reports with new information, or recategorize past reports. Those revised reports do not always automatically become part of the public database.
Have questions about our data or want to know more? Write to us at askus@xtown.la.


