

The Crosstown Crime Book: May 2023


With the Crime Book, Crosstown examines monthly statistics and trends in criminal activity, using publicly available Los Angeles Police Department data. Here is how things looked in May.
Five months into 2023, what at first seemed a trend is now clearly a change: Most categories of violent and property crime in the city of Los Angeles are decreasing. That includes some of the most serious offenses.
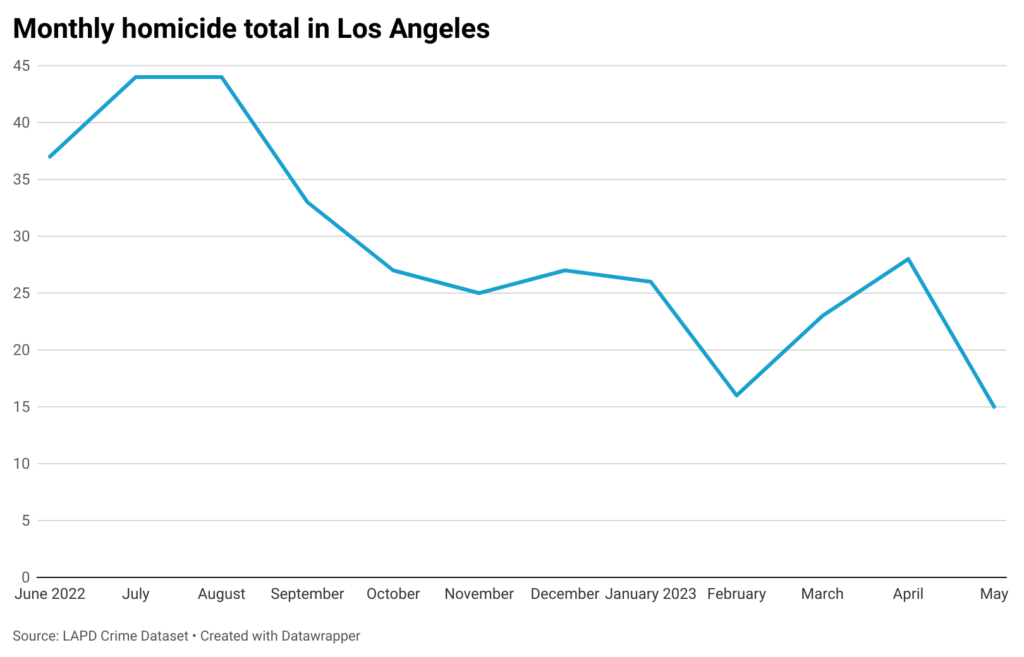
The new year has brought a precipitous drop in murders. The 15 homicides in May is the lowest monthly total since March 2020. It also marks a drastic change from last summer: There were 44 murders in both July and August.
According to LAPD Compstat data, the city has recorded 106 homicides from Jan. 1–May 27, which is a 27.4% decline from the same period last year. That works out to 40 fewer killings.
The count, Police Chief Michel Moore noted at the June 6 Police Commission meeting, is only two more than at the same point in the pre-pandemic year of 2019. The city would end 2019 with 258 murders. Last year the death toll was 382.
[Get crime, housing and other stats about where you live with the Crosstown Neighborhood Newsletter]
The neighborhood with the most homicides so far this year is Downtown, with 15. The next highest counts are in Westlake (10), and Boyle Heights, Broadway-Manchester and Vermont Square (five each)
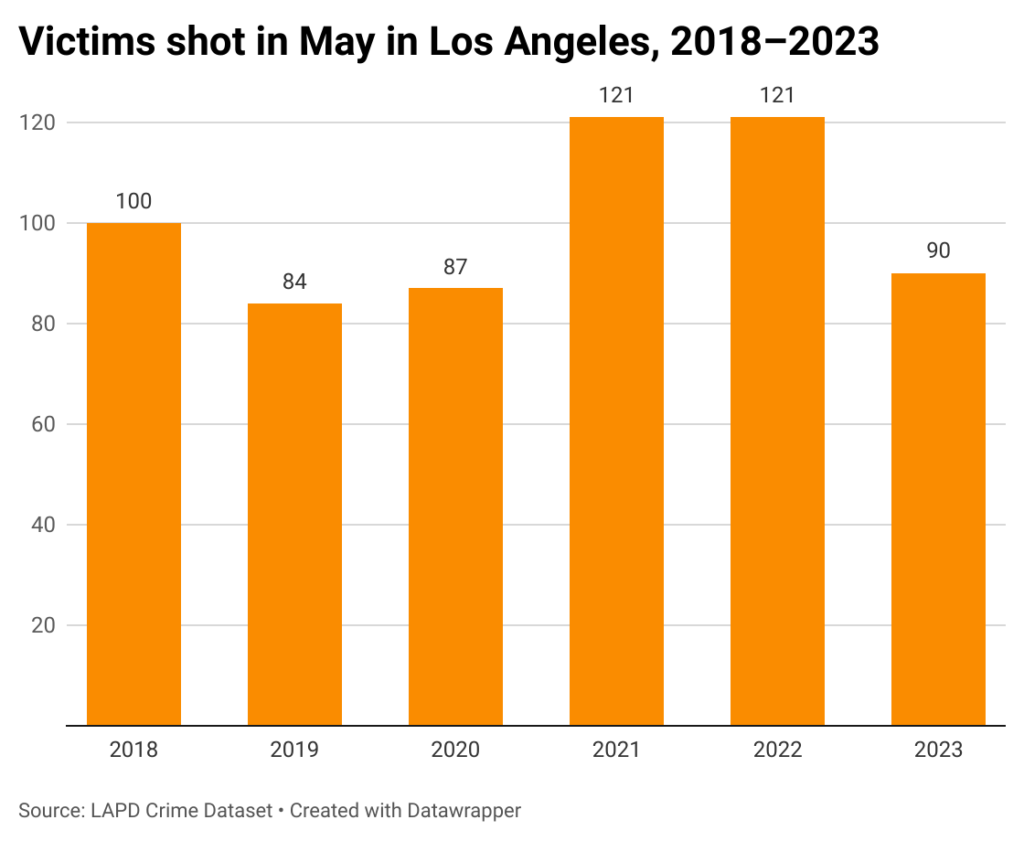
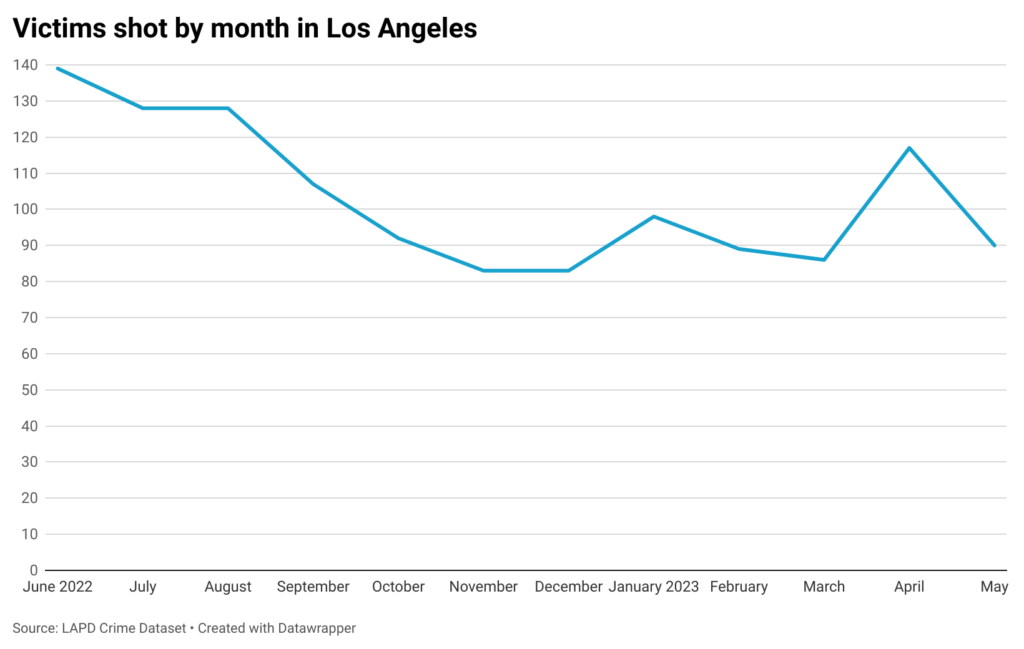
Overall gun violence also remains below the level in 2022. In May there were 90 reports of victims shot. That is a 25.6% decrease from 121 in the same month last year.
May also marks the seventh time in the past eight months with fewer than 100 people struck by gunfire. Before that, in the 28-month period from June 2020 through September 2022, there was only one month with fewer than 100 victims shot.
Improvement is being seen in another violent crime category: robberies. There were 681 robbery reports in May. That is the seventh consecutive month with fewer than 700 robberies; the count had been over 700 for 13 months before that.

Yet the news is mixed when compared with 2019. During the Police Commission meeting, Moore said robberies in the city from Jan. 1–May 27 are down 17% from the same period in 2019. However, he stated, “We actually have 66 additional robberies that involve a firearm. So while we are seeing improvements in regards to our crime, the instances involving gun violence continue to be a challenge for us.”
According to Compstat data, there were 11,305 total violent crimes in Los Angeles from Jan. 1–May 27. That is down 9.9% from the same time last year.
Things taken
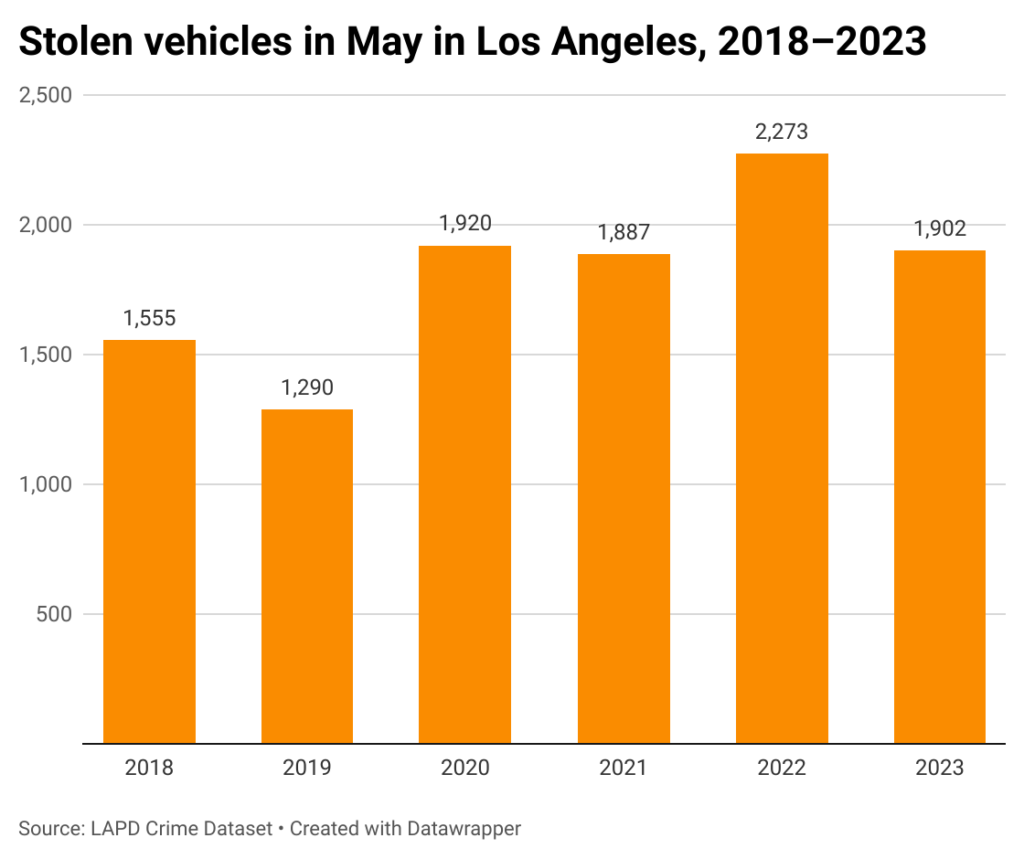
Once the pandemic hit, car thefts surged in the city. Figures have declined recently, and the trend continued in May, with 1,902 stolen vehicle reports. Last May the count was 2,273.
Yet as with robberies, the number is relative. The May car theft total is 47% higher than during the same month in 2019.
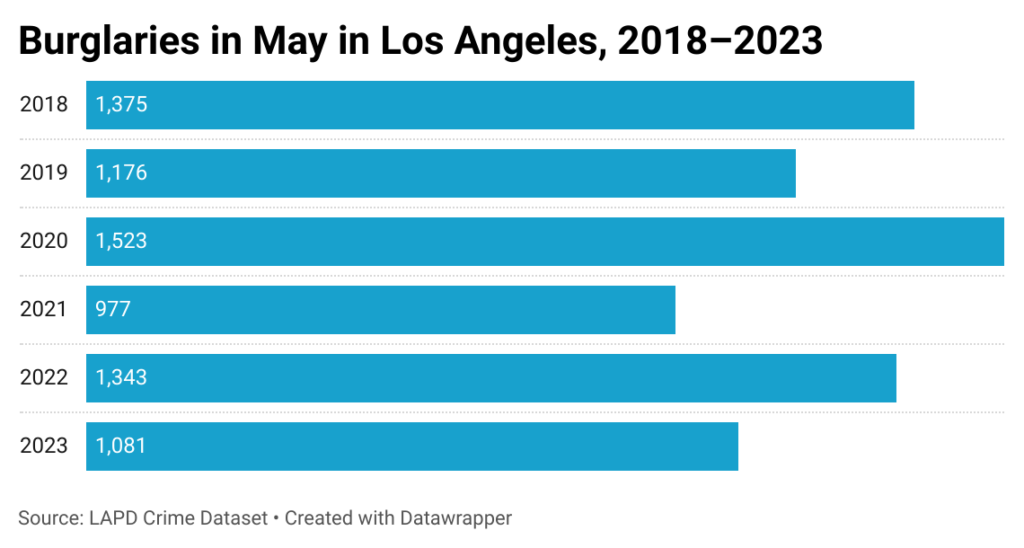
May also brought a decline in burglaries. The 1,081 reports during the month is down from 1,208 in April, and is the lowest count in the past year. It is also a 19.5% decline from the number of burglaries in May 2022.
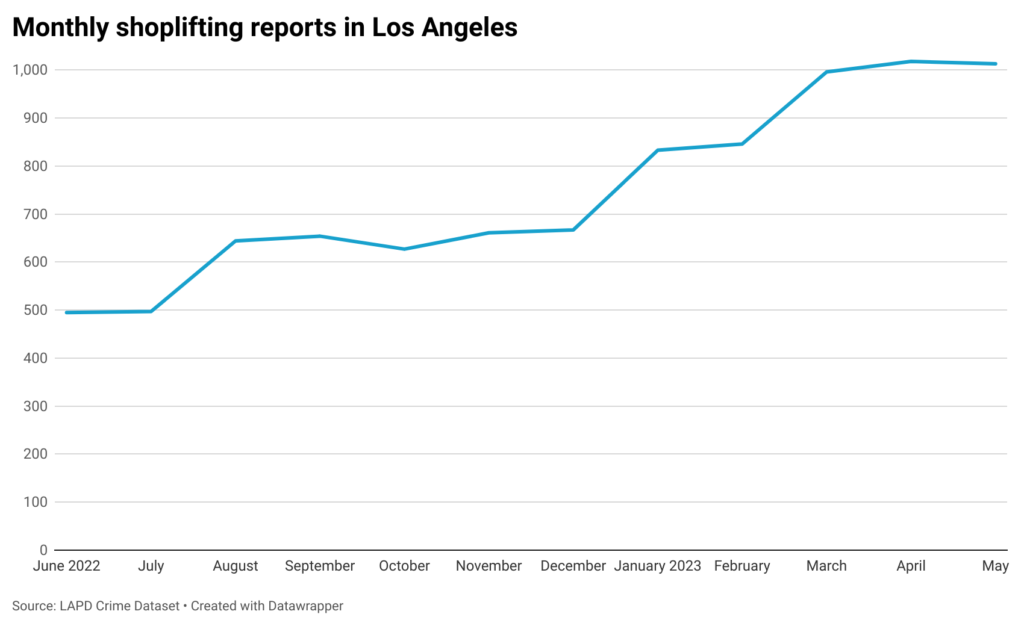
While there are fewer break-ins at homes and businesses, retailers across Los Angeles continue to suffer. In May there were 1,013 shoplifting reports in the city. That is the fifth consecutive month above 800, a level that before this year had not been hit even once since 2010, according to police data.
There were 64 shoplifting reports in Van Nuys last month, more than any other neighborhood. The next-highest totals were registered in Downtown (50) and Mid-Wilshire (49).
The LAPD counts shoplifting in a category called Personal/Other Theft. The number of these incidents from Jan. 1–May 27 is up 14.5% over the total in the same time period last year.
Every other property crime category has decreased from 2022 totals.
How we did it: We examined publicly available crime data from the Los Angeles Police Department from May 1, 2018–May 31, 2023. We also examined LAPD Compstat data. Learn more about our data here.
LAPD data only reflects crimes that are reported to the department, not how many crimes actually occurred. In making our calculations, we rely on the data the LAPD makes publicly available. LAPD may update past crime reports with new information, or recategorize past reports. Those revised reports do not always automatically become part of the public database.
Have questions about our data or want to know more? Write to us at askus@xtown.la.


