Crime in Unusual Places

Los Angeles is filled with stories about crime, as news outlets—Crosstown included—detail everything from a shoplifting surge to armed robberies at convenience stores.
Crime is not limited to those places, of course, and an examination of publicly available Los Angeles Police Department data reveals illegal activity occurring in many locations that people might not expect. Some incidents are violent, but more common is theft or another type of property crime.
[Get crime, housing and other stats about where you live with the Crosstown Neighborhood Newsletter]
As part of an occasional series, Crosstown examines some of the unusual places where crime occurs.
Screen time
Could the new Haunted Mansion remake qualify as a crime against movie-going fans? With its 42% rating on Rotten Tomatoes, that’s possible. But jokes aside, Los Angeles theaters do see occasional lawbreaking.
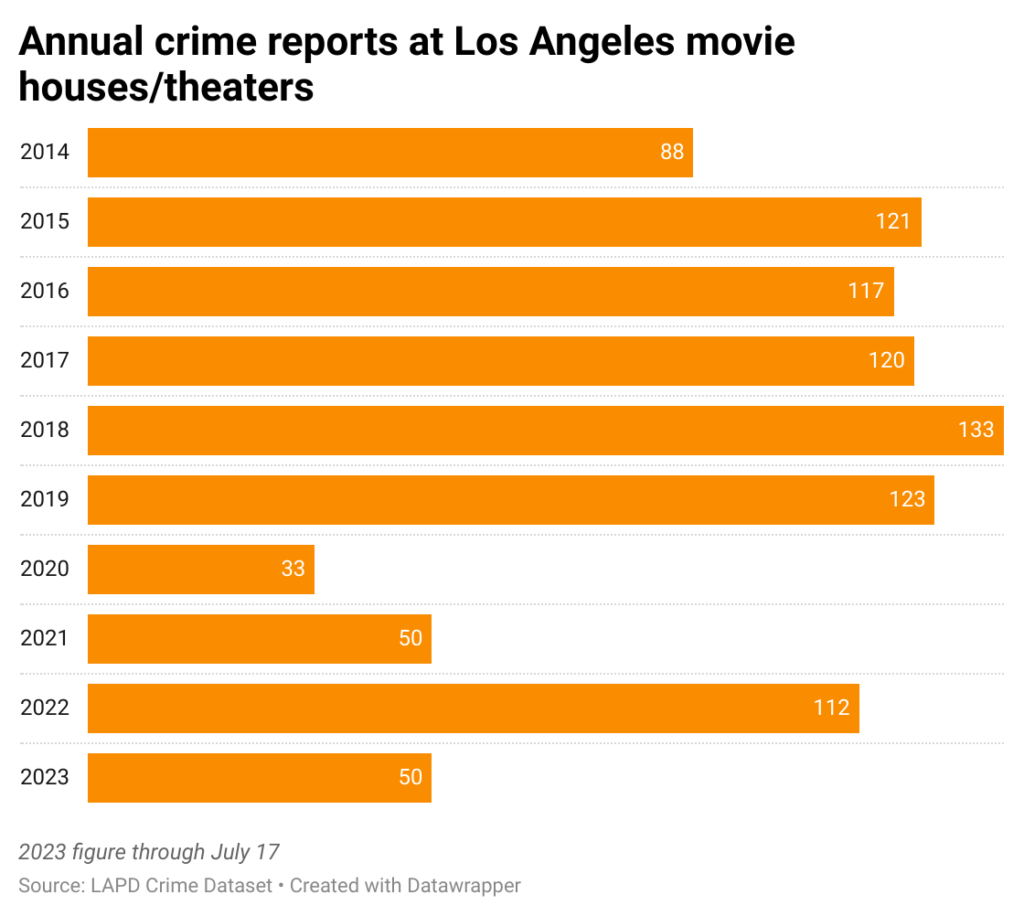
There were 112 crime reports last year that the LAPD listed at “theatre/movies.” The highest annual count in the past decade occurred in 2018, when there were 133 incidents.

Since the start of 2022, counts have bounced in the narrow range of 5-13 each month. Of the 162 reports in that timeframe, 46 occurred in Downtown. The neighborhood with the next highest total is Hollywood (24 reports).
According to police data, there have been 42 reports for battery or simple assault since the beginning of 2022, while petty theft was recorded 24 times. There were four instances of identity theft and one classified as lewd conduct.
Hit the beach
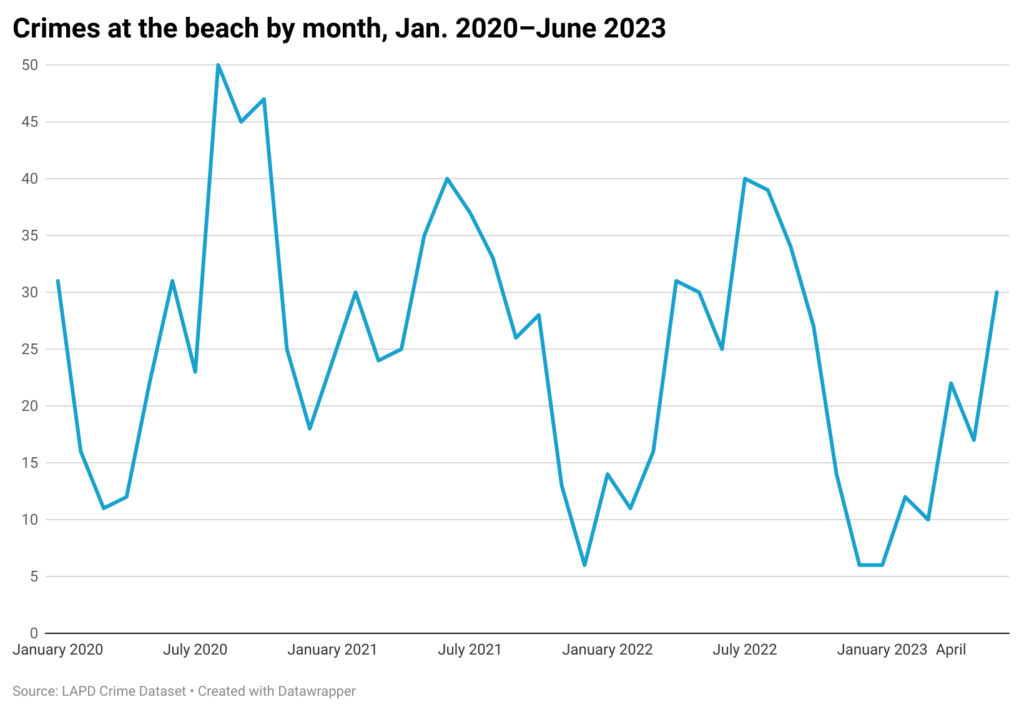
The current heat wave is driving Angelenos to the beach. As happens every summer, the number of crimes there is also rising.
The LAPD logged 30 beach crimes in June, five more than the same month last year. The 2022 peak was the 40 crimes tabulated in July. The monthly high in the last decade was the 50 incidents in August 2020, during the first pandemic summer.

From Jan. 1–July 17 this year (the latest date for which data is available), there have been 113 crime reports at beaches in the city of Los Angeles. Thirty of these were classified as assault with a deadly weapon or aggravated assault, while the second most-common offense was grand theft (where items valued at more than $950 were taken). On five occasions a weapon was brandished.
The incidents include a May 7 robbery in Playa Del Rey, when a 23-year-old unhoused man was attacked by a stranger. According to police data, he was knocked to the ground and unspecified items were taken.
Theft at the museum
Movies, TV shows and podcasts are filled with real and fictional tales of daring thefts from museums. Some crime does occur at Los Angeles museums, but mostly it is low-level incidents.
Of the 292 museum crimes logged since 2014, the highest number—60—involved petty theft, with the value of stolen items below $950. There were 41 cases of felony vandalism, with damage north of $400. Four times there were bomb scares. Only once was a gun brandished.
Since the start of 2022, the community with the highest number of museum crimes is Griffith Park, with 11 incidents. Most occurred at the Griffith Observatory and all were property crimes, including four pickpocket reports. (Griffith Park this spring also saw an overall rise in car break-ins, which led to the LAPD deploying mounted units to combat thieves.)
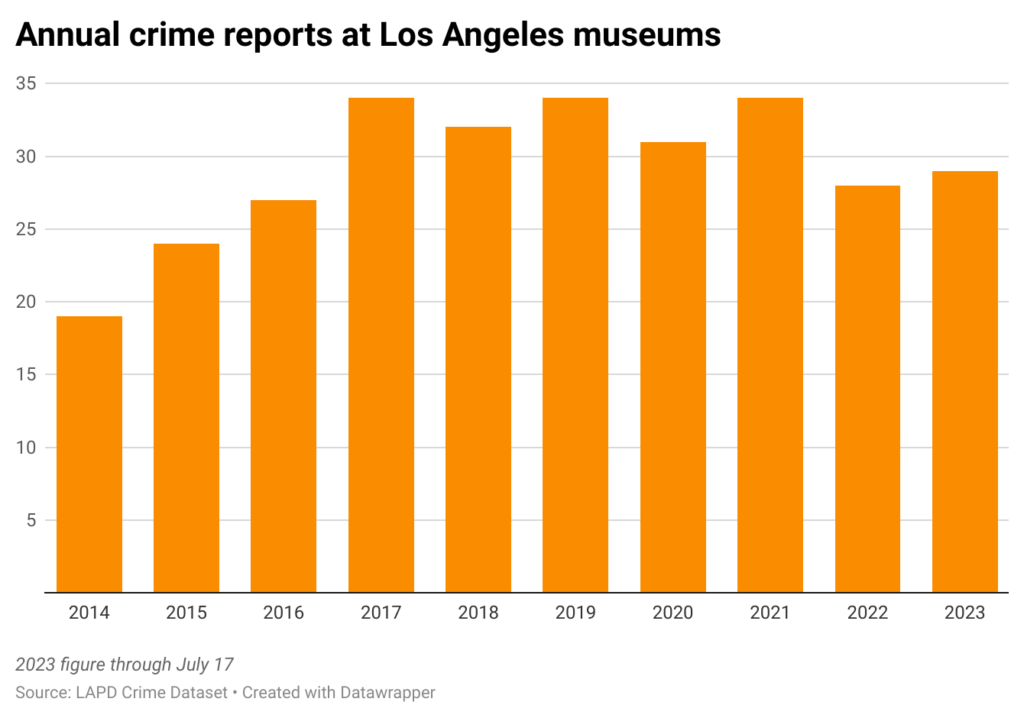
One thing to track: Since 2014, the highest annual number of museum crimes was 34. Yet there have been 29 reports from Jan. 1–July 17 this year, exceeding the total in the entirety of 2022.

There were nine crimes at museums in April, the highest monthly total ever. All were property crimes, including one report of vandalism at a Wilshire Boulevard institution on April 25.
How we did it: We examined publicly available crime data from the Los Angeles Police Department from Jan. 1, 2010–July 17, 2023. Learn more about our data here.
LAPD data only reflects crimes that are reported to the department, not how many crimes actually occurred. In making our calculations, we rely on the data the LAPD makes publicly available. LAPD may update past crime reports with new information, or recategorize past reports. Those revised reports do not always automatically become part of the public database.
Have questions about our data or want to know more? Write to us at askus@xtown.la.


