

COVID-19 cases remain steady, but hospitalizations tick up


In each of the last two years, a fall lull in COVID-19 infections was followed by a climb in cases in November. The increase was attributed to holiday gatherings and colder weather that drove more people indoors, where transmission is easier.
This year, the caseload is remaining stable. On Wednesday, according to the Los Angeles County Department of Public Health, there was a seven-day daily average of 249 cases. That is down from 275 the week before, and continues a nearly two-month run with the average below 300.
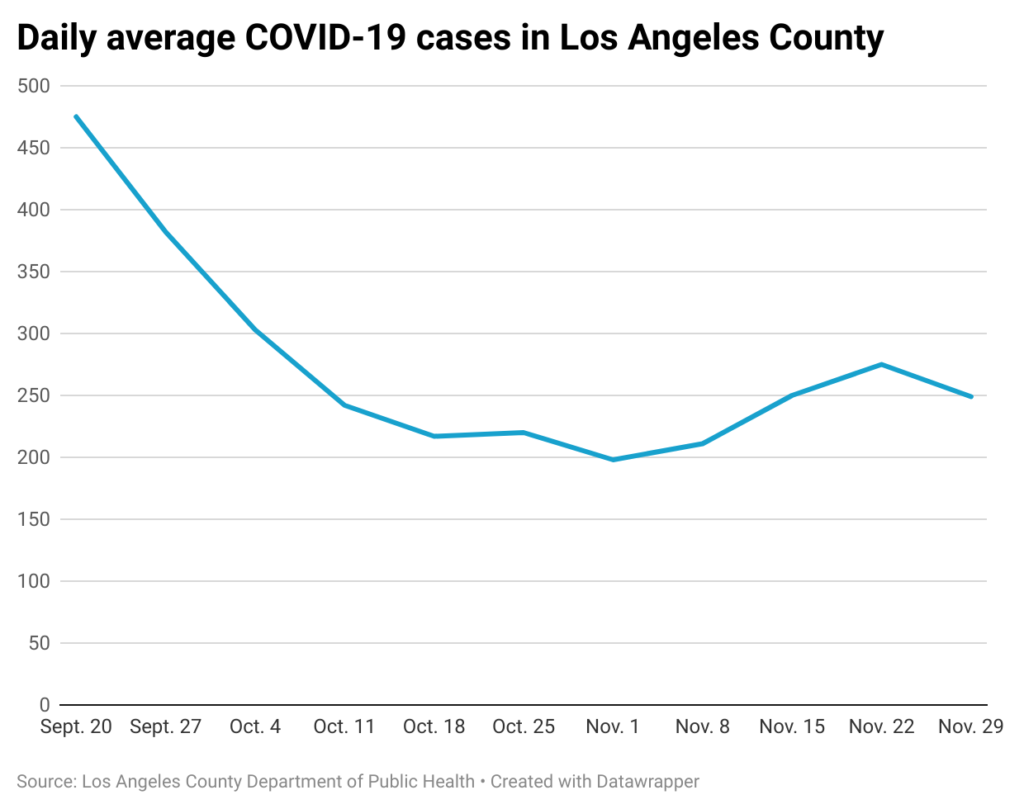
The highest counts ever came in early 2022, when the Omicron variant raced across the region. That January there were five consecutive days with more than 40,000 new cases.
[Get crime, housing and other stats about where you live with the Crosstown Neighborhood Newsletter]
Current figures are difficult to compare with the past, given that most cases now identified with at-home tests are never reported to public health officials. In addition, widespread vaccinations and past infections have provided a level of protection, so even if people contract the coronavirus, the risk of severe illness or death is lessened.
Therapeutics such as Paxlovid can also help reduce the severity of a case.
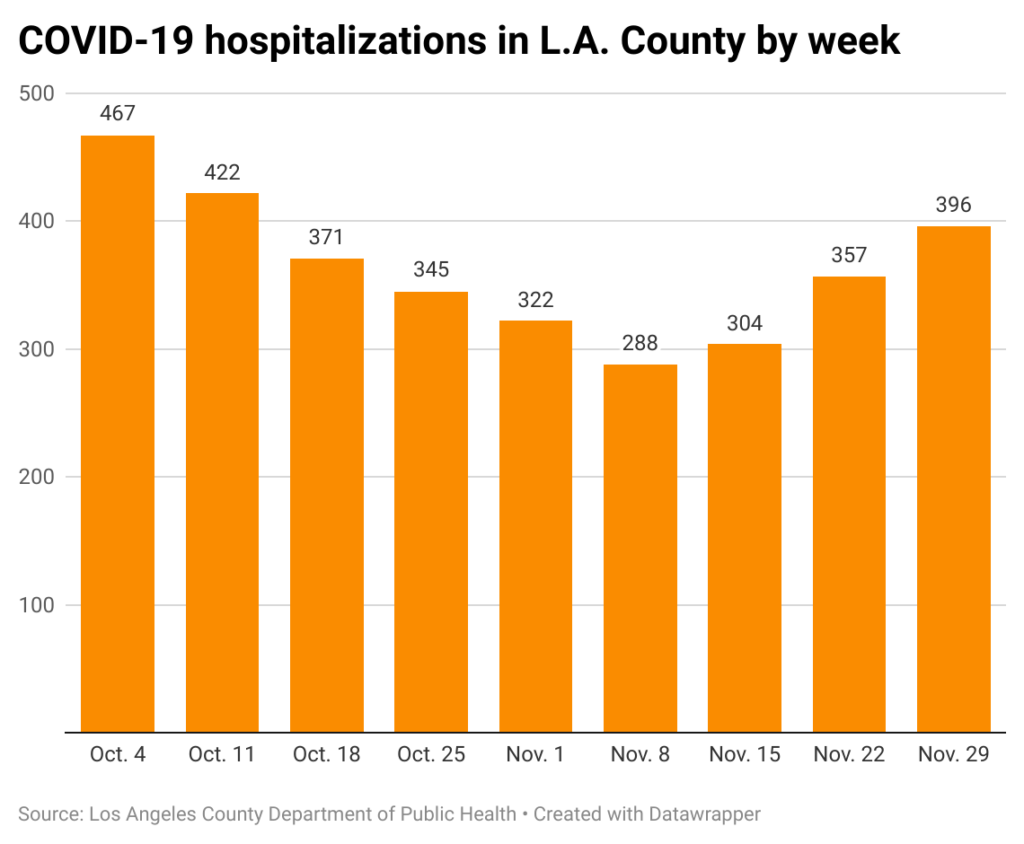
Still, for some people, the complications of a coronavirus infection pose serious health concerns. That is exemplified by an increase in hospitalizations.
On Wednesday, 396 COVID-19 patients were in Los Angeles County hospitals, according to the Department of Public Health. That is up 37.5% from the recent low of 288 hospitalizations recorded on Nov. 8.
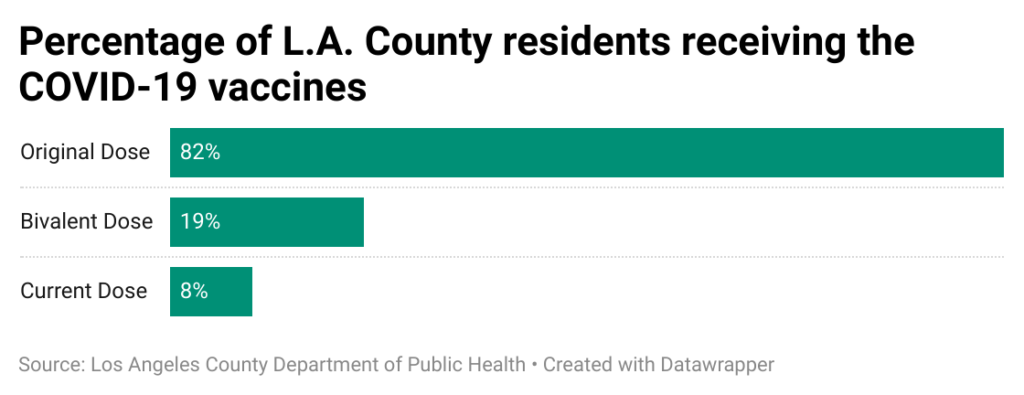
Although the new vaccine is available across the region, uptake remains slow. According to the Department of Public Health’s vaccine dashboard, only 761,000 of the latest shots have been administered in the county, accounting for about 8% of the population. More than 19.9 million original doses were dispensed.
The most vaccinated group continues to be seniors, though even their level of inoculation has slowed markedly. More than 95% of people 65 and older in the county received a dose of the original vaccine, but just 20.1% have taken the latest shot.
The L.A. County level slightly exceeds the 19.2% of seniors across California who are considered up to date on their vaccinations. According to a state dashboard, only 6.7% of California’s population has received the updated dose.
The Centers for Disease Control and Prevention has recommended that everyone 6 months and up get the new vaccine. Information on how to find a shot is on the Department of Public Health’s website or through the Public Health Call Center at (833) 540-0473.
How we did it: We analyzed coronavirus data through Nov. 29, 2023, related to new cases, deaths, hospitalizations and vaccinations provided by the Los Angeles County Department of Public Health. The data only reflects cases reported to the department, and not how many cases actually occurred. We also examined state of California vaccine data.
Learn more about our data here. Any questions? Email askus@xtown.la.


