

Los Angeles surpasses both 300 murders and traffic collision deaths


Although there are still almost two weeks left in 2023, Los Angeles has already surpassed a pair of grim markers: The city has suffered more than 300 murders, and more than 300 people have died in traffic collisions.
This marks the second consecutive year that the level has been reached in each category, though trends are going in opposite directions. Through Dec. 9, the city had tabulated 312 homicide victims. That is down 16% from the same period last year, according to Los Angeles Police Department Compstat data.
[Get crime, housing and other stats about where you live with the Crosstown Neighborhood Newsletter]
But as Crosstown recently reported, more people are dying in auto collisions, whether they involve vehicles smashing into each other, or someone on foot or bike being struck by a car. Through Dec. 2, there had been 307 such deaths, according to LAPD Traffic Division Compstat data. That is up 7% from the 288 fatalities at the same point in 2022.
Gun violence continues
Every year in the 2010s, the city recorded fewer than 300 murders, and in the pre-pandemic year of 2019, there were 258 homicide victims. The number of traffic fatalities was also below 300 each year that decade. In 2019, there were 247 vehicle-related deaths.
Homicides began skyrocketing in Los Angeles after the onset of the pandemic, a trend that played out in many major U.S. cities. This marks the fourth consecutive year with more than 300 murders. The peak was the 402 people killed in 2021.
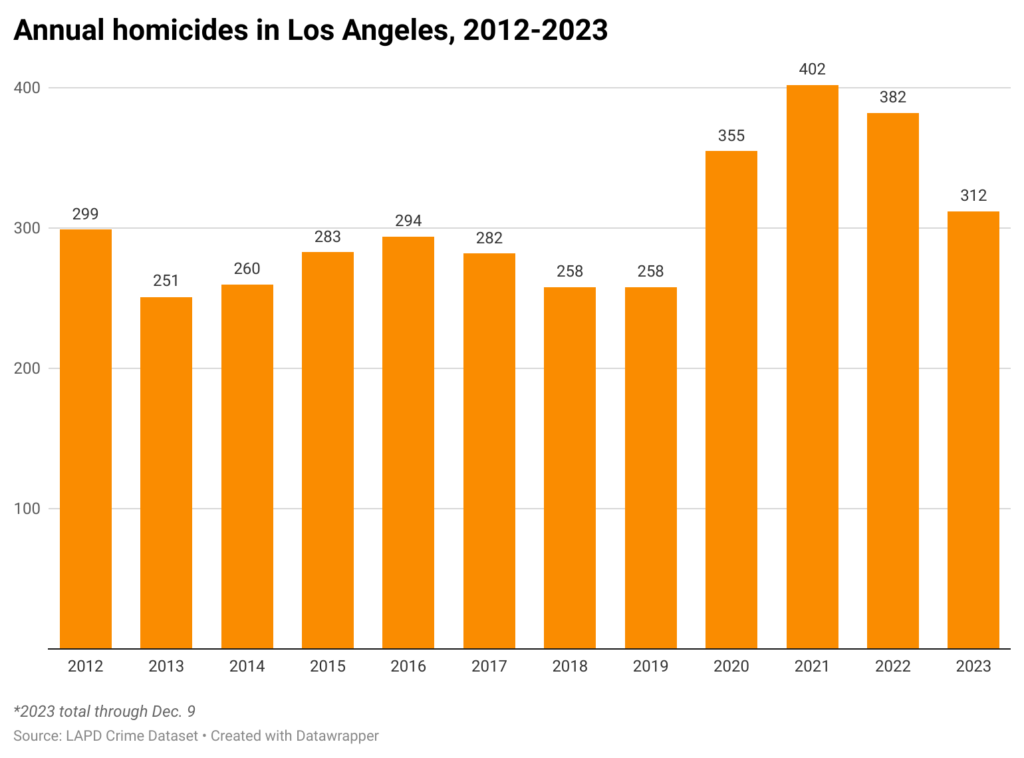
According to publicly available LAPD data, the 300th homicide this year occurred on Nov. 21. That is later than in the recent past. In 2022, the 300th murder was recorded on Sept. 21. In 2021 it happened on Sept. 26.
At the Dec. 12 meeting of the Los Angeles Police Commission, Chief Michel Moore touted the 60 fewer homicides than at the same time last year. He said one notable decrease in 2023 has been murders of people experiencing homelessness. As Crosstown recently reported, 51 unhoused individuals were killed from Jan. 1–Nov. 30. The full-year total in 2022 was 92.
“On the other side,” he said, “we still see gang crime in the city representing far too much shooting violence. Over half of our homicides still are gang-related.”
Approximately 72% of the murders in the city this year have involved a firearm. A knife or other sharp object was the murder weapon 10 times.
Downtown has been the site of 32 homicides this year, more than any other neighborhood in the city. The next highest count is the 23 killings in Boyle Heights.
On the roads
In recent months the region has recorded a string of tragic, deadly collisions. On Oct. 17, a driver reportedly speeding at more than 100 mph on Pacific Coast Highway in Malibu struck a parked vehicle, setting off a chain reaction that claimed the lives of four Pepperdine University students. The District Attorney’s office charged Fraser Bohm with four counts of murder and four counts of vehicular manslaughter with gross negligence. Bohm pleaded not guilty.
On Thanksgiving, three people—including a 5-year-old boy and his mother—died in two separate traffic collisions in South Los Angeles.
In 2015, the city registered just 186 traffic deaths, though the count has been over 240 every year since then. In 2022, there were 314 traffic fatalities on city streets.
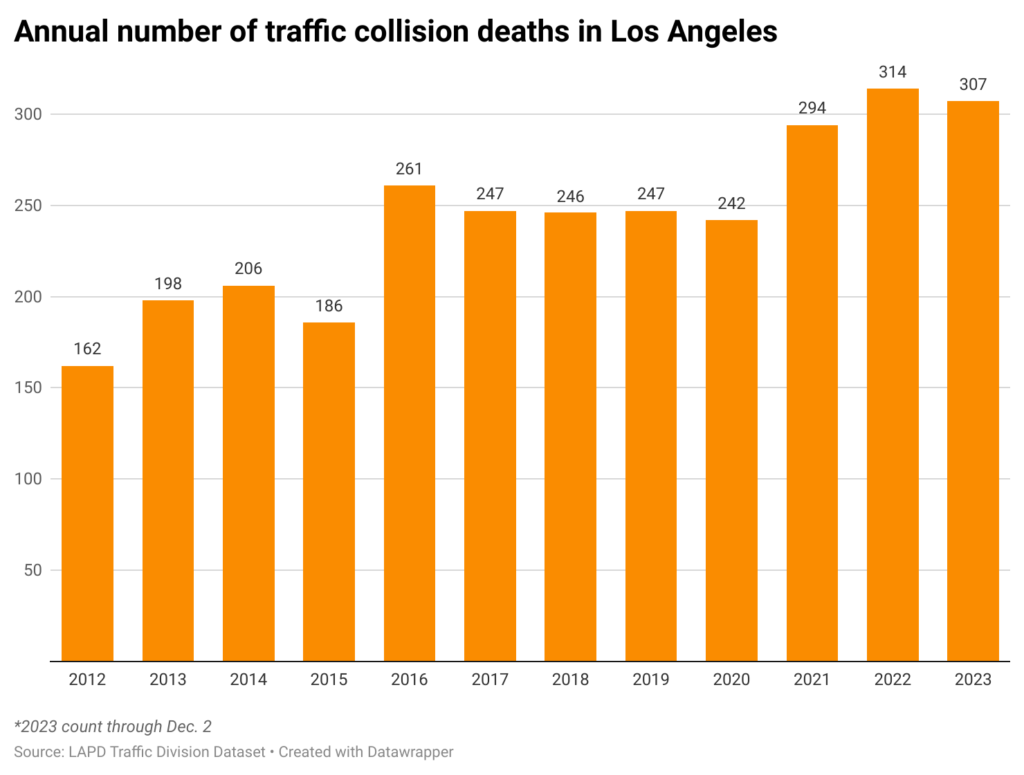
The 300th traffic fatality this year occurred on Nov. 22. Last year it was tabulated on Dec. 16.
The rise in deaths has been attributed to multiple factors, among them the prevalence of larger, heavier cars and SUVs that in a collision deliver a more forceful impact than smaller vehicles. Also playing a role is distracted drivers who text or fiddle with a phone when their attention should be solely on the road.
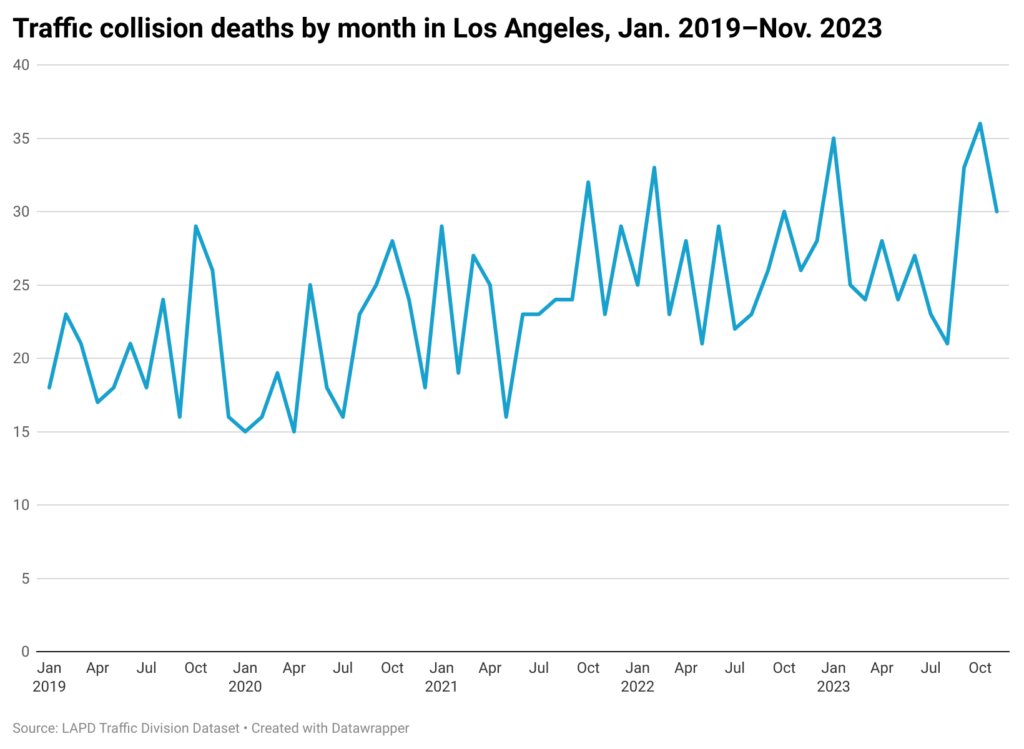
The last three months have been particularly deadly, with 99 total fatalities in the months of September, October and November, according to LAPD Traffic Collision data.
Elevated numbers of traffic deaths this year have occurred all across Los Angeles. There were 15 in auto-filled Downtown. Sun Valley, in the east San Fernando Valley, was the site of 12 fatalities, and 11 people were killed in collisions in the South L.A. neighborhood of Manchester Square.
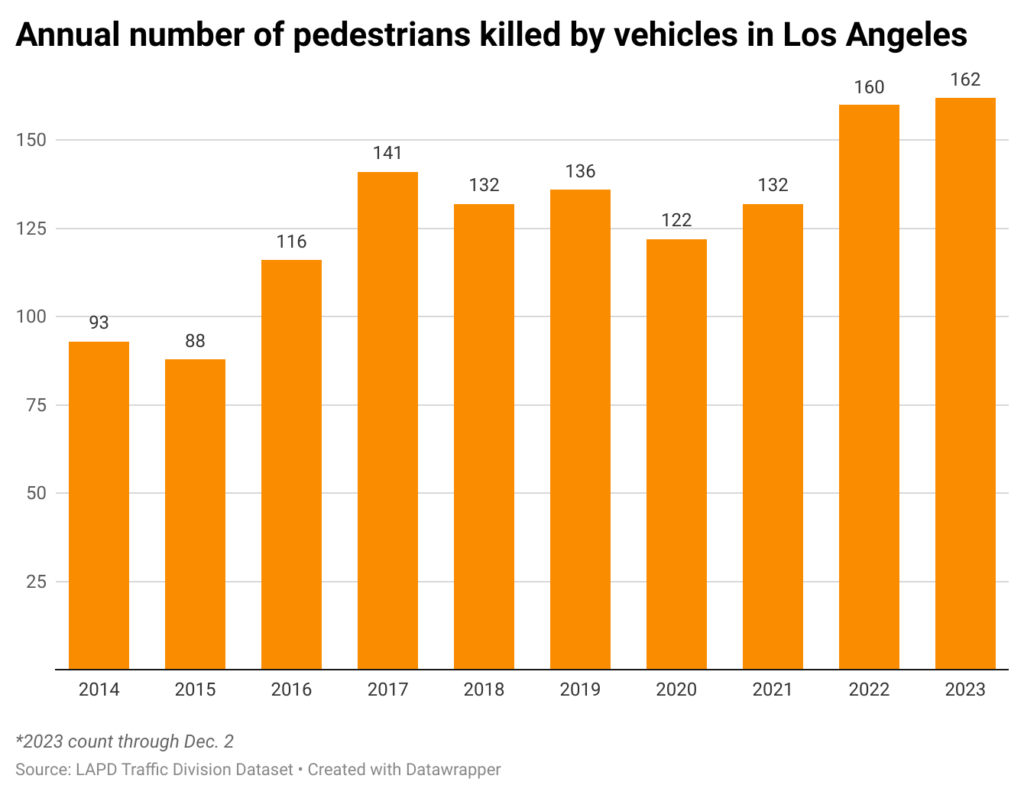
Twenty-nine people died in DUI-related collisions from Jan. 1–Dec. 2, compared with 22 in that time frame last year. According to Traffic Division Compstat data, 162 pedestrians were killed after being hit by a car. The number in the same period in 2022 was 146.
The danger extends to those on two wheels, with 23 bicyclists dying on the city’s roads this year. That is up from 20 in the same period in 2022.
How we did it: We examined publicly available crime data from the Los Angeles Police Department from Jan. 1, 2010–Dec. 9, 2023, and data from the Los Angeles Police Department Traffic Division from January 1, 2010–Dec. 2, 2023. We also examined LAPD Compstat data and LAPD Traffic Division Compstat Data. Learn more about our data here.
LAPD data only reflects crimes and collisions that are reported to the department, not how many actually occurred. In making our calculations, we rely on the data the LAPD makes publicly available. LAPD may update past crime and collision reports with new information, or recategorize past reports. Those revised reports do not always automatically become part of the public database.
Have questions about our data or want to know more? Write to us at askus@xtown.la.


