

How murders in Los Angeles compare with the rest of California


In 2023, the city of Los Angeles recorded 327 murders. It’s a tragic loss of life, and results in a homicide rate that exceeds most big cities across California.
A city’s homicide total is often used to judge overall safety, but understanding the death toll requires context. The Los Angeles murder rate—the number of killings per 100,000 residents—is below that in many other major municipalities across the country. While the 327 killings is above pre-COVID levels, it is also 65 fewer than in 2022.
[Get crime, housing and other stats about where you live with the Crosstown Neighborhood Newsletter]
A new report from California Attorney General Rob Bonta, along with Los Angeles Police Department reports released earlier this year, show how the city and the state compare.
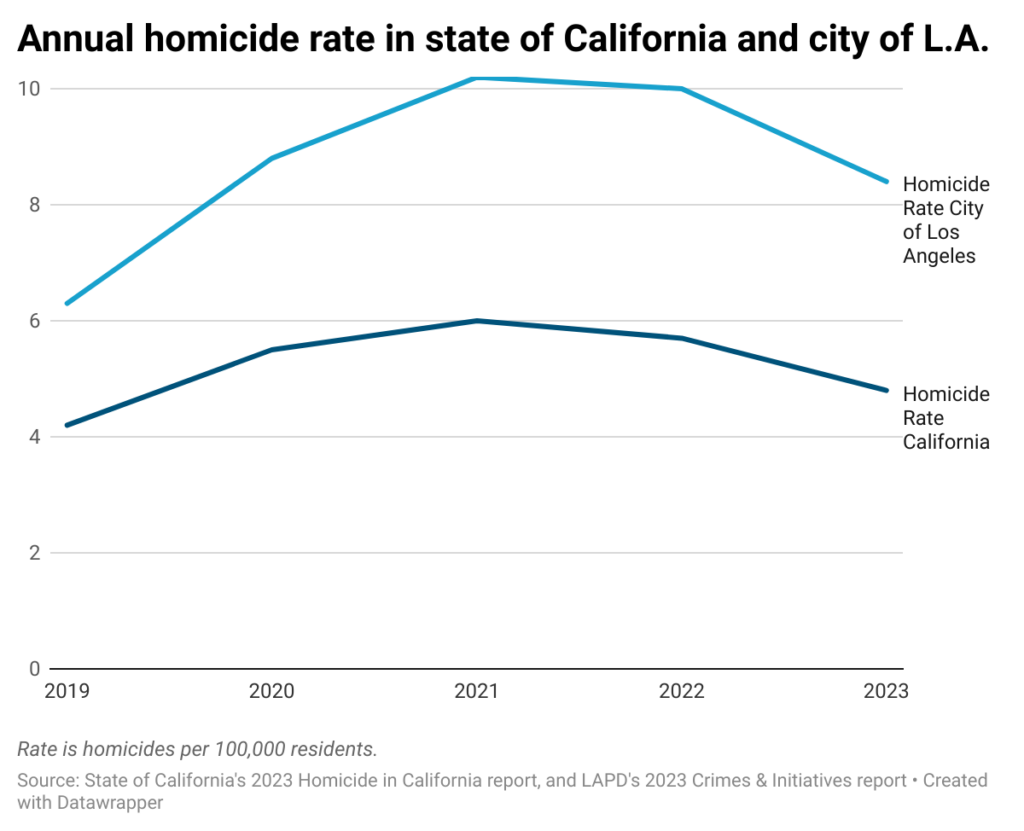
The murder rate in the city last year was 8.4 per 100,000 residents. The statewide figure was 4.8 per 100,000 inhabitants, according to Bonta’s Homicide in California 2023 report. The city figure regularly exceeds the statewide level.
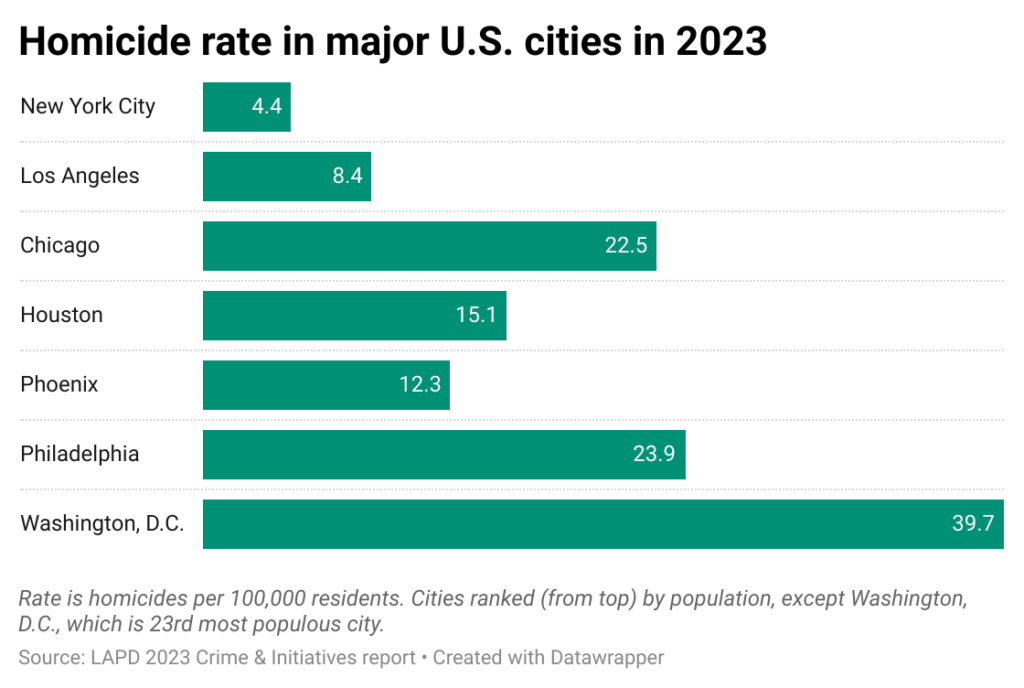
Major metropolitan areas across the country often see elevated crime and homicide rates, a result of factors including density, income level and historic racial inequities. The Los Angeles Police Department’s 2023 Crime and Initiatives Report found the city’s rate to be above New York City’s 4.4 killings per 100,000 residents, but below the level in Houston (15.1) and Chicago (22.5). The Washington, D.C. rate was 39.7 murders per 100,000 residents, according to the report.
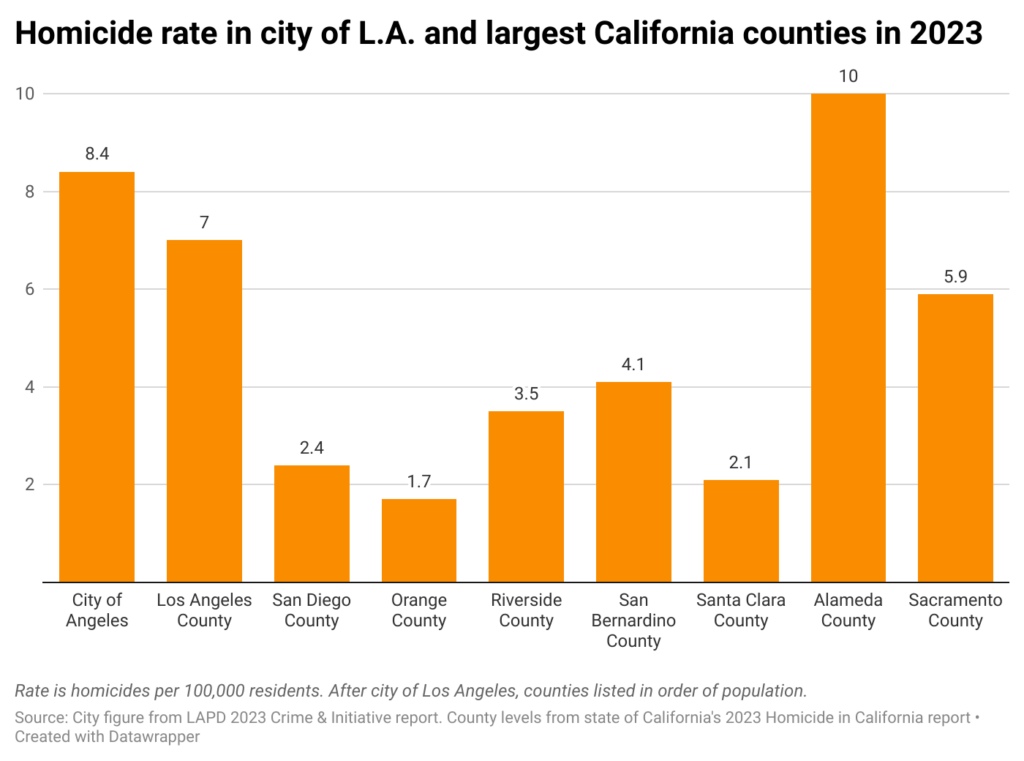
Bonta’s report breaks down the total and murder rate for each of the 58 counties in the state. The Los Angeles County figure in 2023 was seven homicides per 100,000 residents. In San Diego County, which has the second-largest population, the rate was just 2.4 per 100,000 inhabitants (79 total homicides). Orange County, the third-most populous county in the state, had 54 murders, or a rate of 1.7 killings per 100,000 residents.
At the other end of the spectrum is Alameda County, where spiking violence in the city of Oakland contributed to a countywide total in 2023 of 165 murders, making it one of the few places where the year-over-year figure increased. That works out to 10 killings per 100,000 residents.
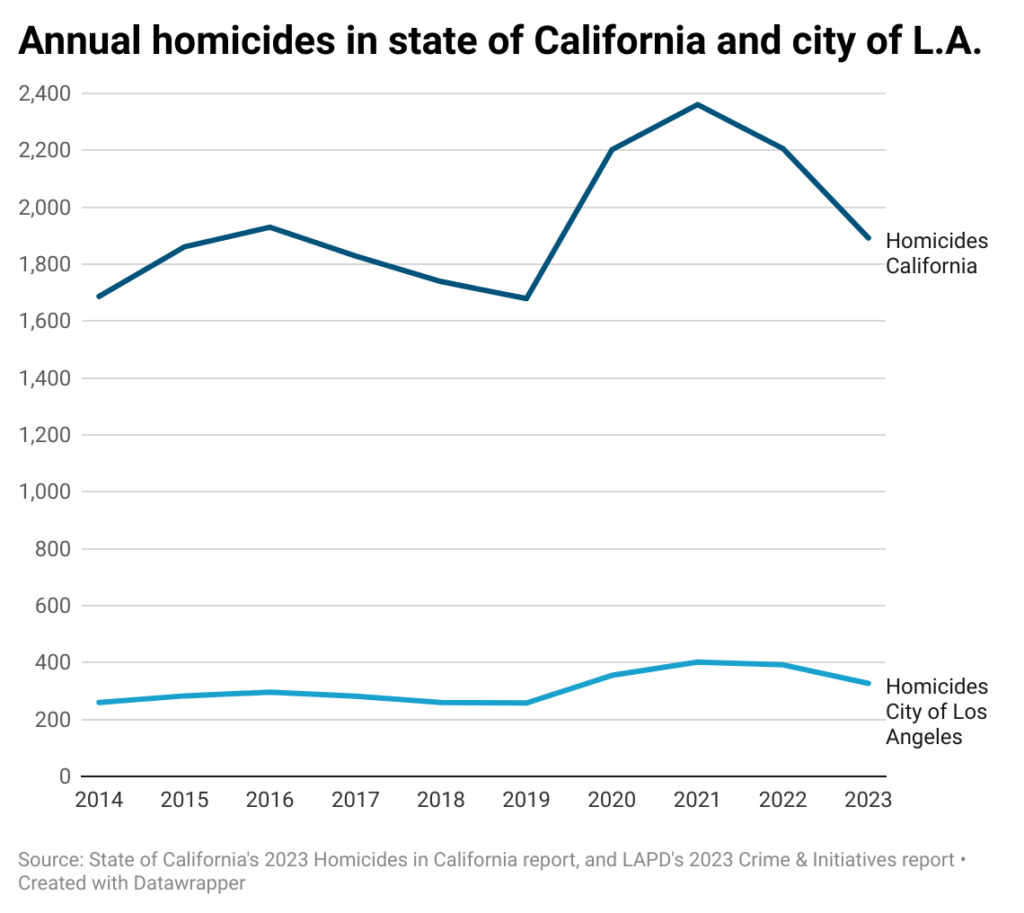
The situation, particularly in Los Angeles, has been much worse. During the late 1980s and early ’90s the city was infamous for homicides tied to the drug trade. There were more than 1,000 murders in the city in 1992 alone.
Numbers have since fallen substantially. In the past decade the city and state have followed comparable trend lines, with homicides relatively low in the mid 2010s, spiking at the onset of the pandemic, then declining in each of the past two years. California in 2023 suffered 1,892 murders, down 14.2% from the previous year.
Black people suffer disproportionately
Homicides often disproportionately impact communities of color. That remains the case in Los Angeles and California as a whole, though locally, the Black community suffers to an even greater degree.
The city of Los Angeles is 8.6% Black, but according to the LAPD, Black people accounted for 37% of homicide victims in 2023. The statewide population is 6.5% Black, according to U.S. Census figures; 26.6% of murders victims in 2023, or 503 people killed across California, were Black.
The 48% of Angelenos identified as Latino exceeds the statewide level of about 40%. In 2023, 49% of the homicide victims in Los Angeles were Latino; the figure was 47% statewide, or 890 people.
White people comprise about 28% of the city’s population, but accounted for just 7% of murder victims last year. Statewide 17% of victims (321 people) were white; California is 34.3% white, according to a Census report.
The city’s population is about 11.8% Asian, and just 2% of local murder victims were Asian. Approximately 16.5% of Californians are Asian. The statewide report does not break down the number or percentage of Asian murder victims in 2023.
Many more men are killed
There are some similarities between local and statewide homicide trends. In 2023, approximately 80% of murder victims in California were male; the figure was about 86% in the city, according to an annual homicide report published by the LAPD.
Firearms are overwhelmingly the most-common weapon no matter the location—a gun was used in about 73% of homicides statewide, and 72% in the city of Los Angeles. Knives were employed in 11% of city killings, and about 14.1% throughout California.
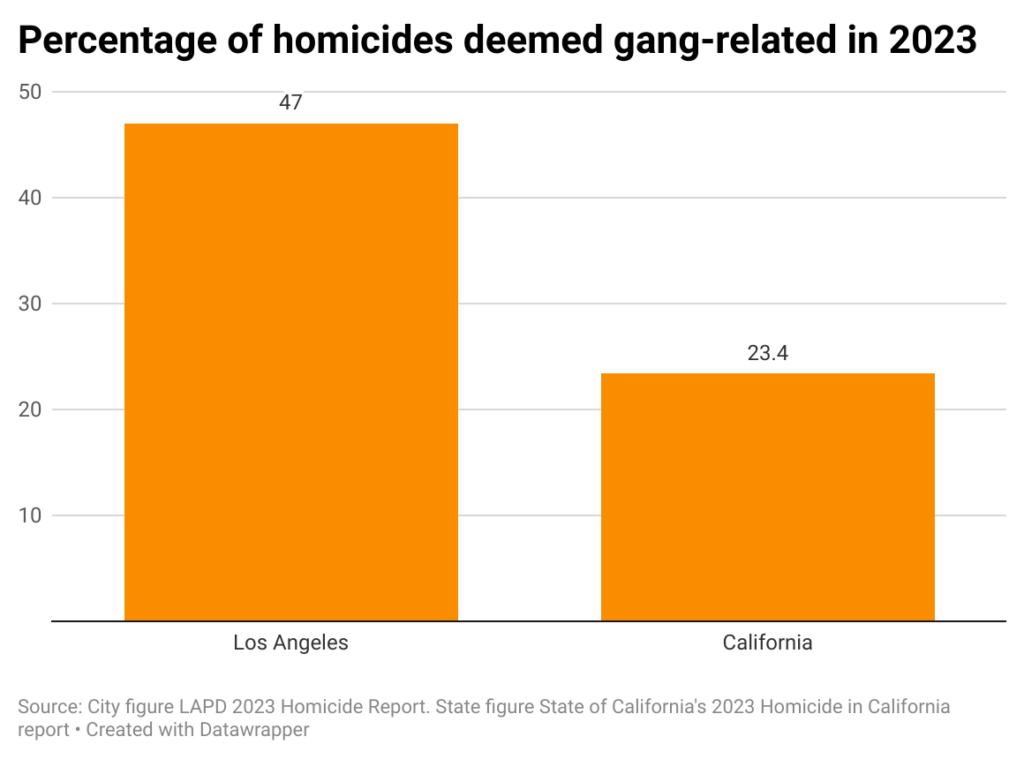
In other sectors there are notable differences. Although the number of gang-related killings in the city of Los Angeles decreased significantly in 2023 from the previous year, there were still 154 such murders, accounting for 47% of the total. The statewide level was 23.4%.
Another area where LAPD figures are higher carries positive connotations: The department in 2023 had a clearance rate of 76%, barely changed from the previous year. The statewide level was 61.6%; that was the first time above 60% since 2019.
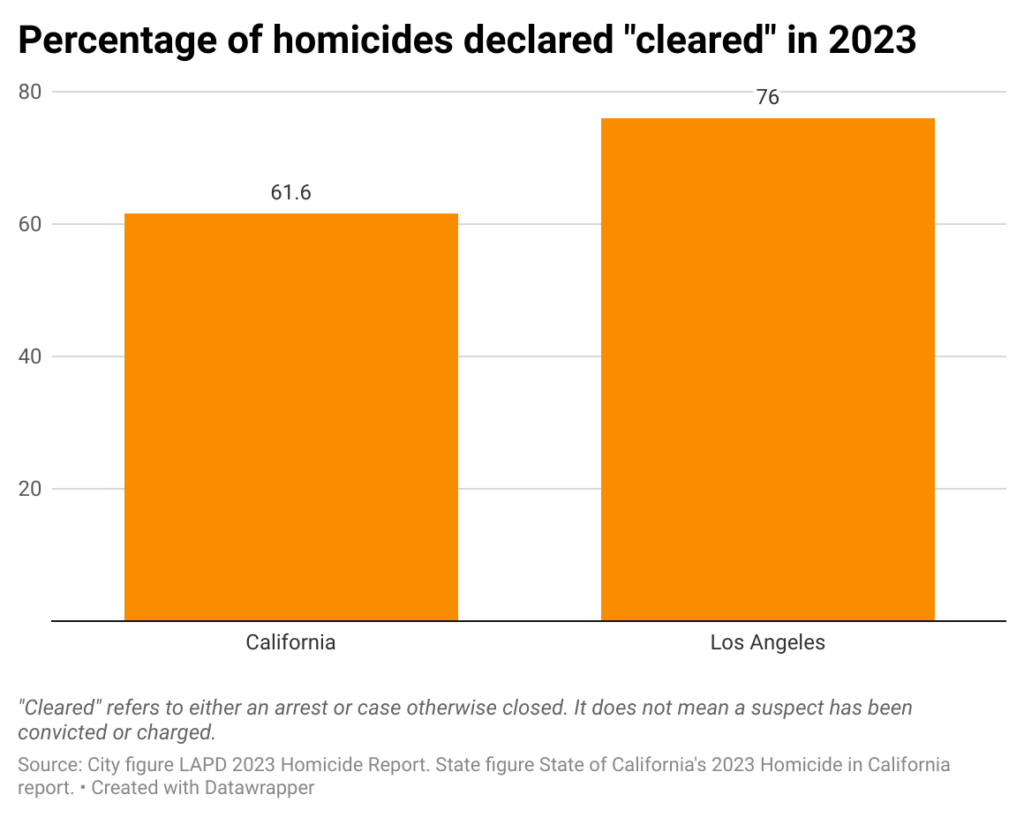
“Clearance” refers to either an arrest or, according to the LAPD, a case “investigated to the extent where no further action is possible based on specific criteria.” It does not mean someone has been convicted or even charged.
How we did it: We examined publicly available crime data and reports from sources including the California Attorney General’s Homicide in California 2023 report; the LAPD’s 2023 Crime and Initiatives report; the LAPD’s 2023 Homicide Report; and publicly available the LAPD data from 2010–2023.
The state data is subject to change, as it does not include full-year figures from all California counties. LAPD data only reflects crimes that are reported to the department, not how many crimes actually occurred. LAPD may update past crime reports with new information, or recategorize past reports. Those revised reports do not always automatically become part of the public database.
Have questions about our data or want to know more? Write to us at askus@xtown.la.


