

COVID makes a summer comeback in Los Angeles


![]()
For many people, COVID-19 has become an afterthought. But in Los Angeles, the number of diagnosed cases and hospitalizations is ticking upwards.
Numbers are nowhere near what they were early in the pandemic, and few people these days wear masks or take other precautions. Additionally, many people have a level of protection either from vaccinations or past infections.
Still, there has been a recent surge, which health officials attribute to a collection of variants known as FLiRT. Medical experts have said they may be more transmissible than previous coronavirus strains, though there is no evidence that they cause more severe symptoms.
[Get crime, housing and other stats about where you live with the Crosstown Neighborhood Newsletter]
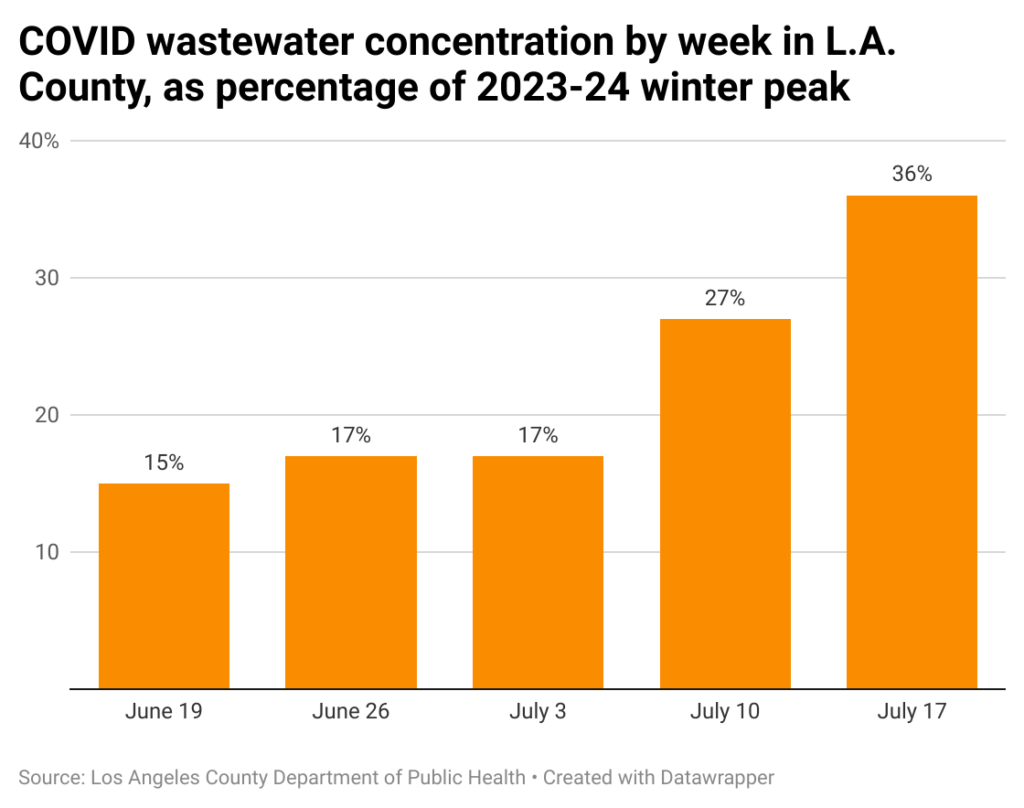
The nation has experienced a rise in the amount of COVID detected in wastewater, according to the Centers for Disease Control and Prevention. The level in California’s 43 monitoring stations outpaces the country’s gain, putting the state in the “very high” category.
In Los Angeles the wastewater concentration as of July 17 stands at 36% of last winter’s peak, according to publicly available data from the Los Angeles County Department of Public Health. On June 19 it was at 15% of the peak.
The number of cases has more than tripled in the span of two months. On May 15, the region was identifying a daily average of 98 infections, according to the Department of Public Health’s COVID-19 dashboard. As of July 10, the figure had climbed to 384.
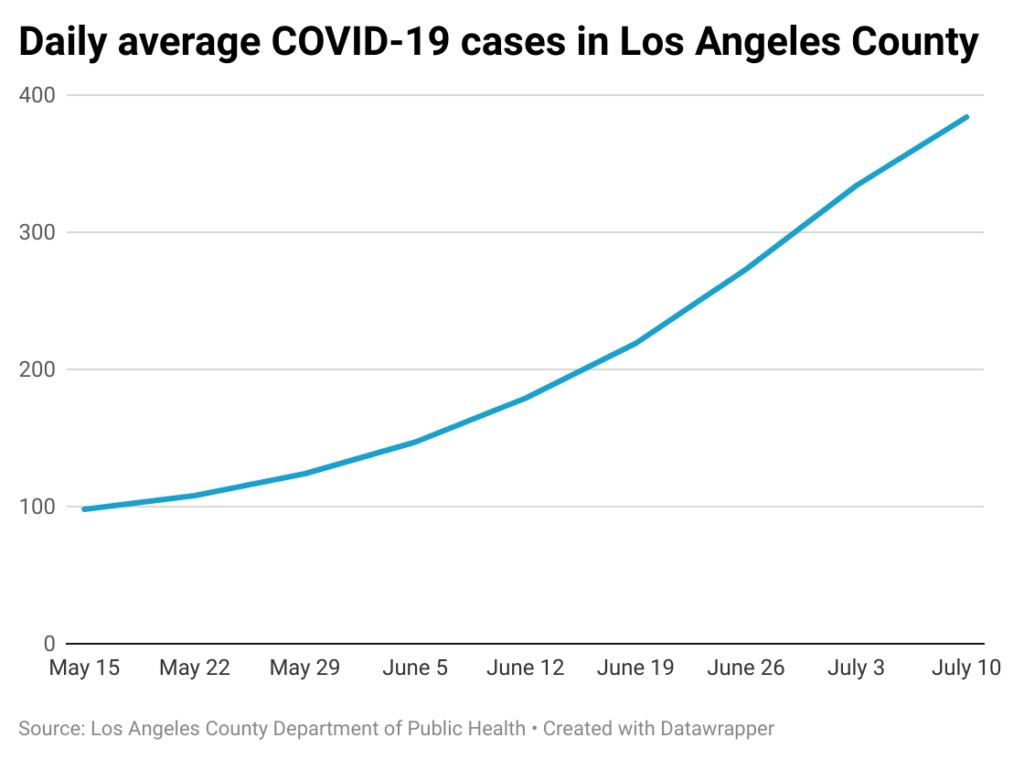
Cases are known to be an undercount, as they only include those identified to health authorities. Most infections detected in at-home tests are never publicly reported.
Past summers also produced a bounce due to increased gatherings. A recent Department of Public Health statement noted that in 2021 and 2023, key metrics began to rise in July. In 2022 the uptick started in May.
Filling hospital beds
In the first winter of COVID-19, Los Angeles saw a peak of more than 8,000 hospitalizations. It was the strain on the healthcare system that prompted the forced closure of many businesses.
Hospitalizations have never again approached that level, and numbers have gone up and down; last September more than 600 people were hospitalized.
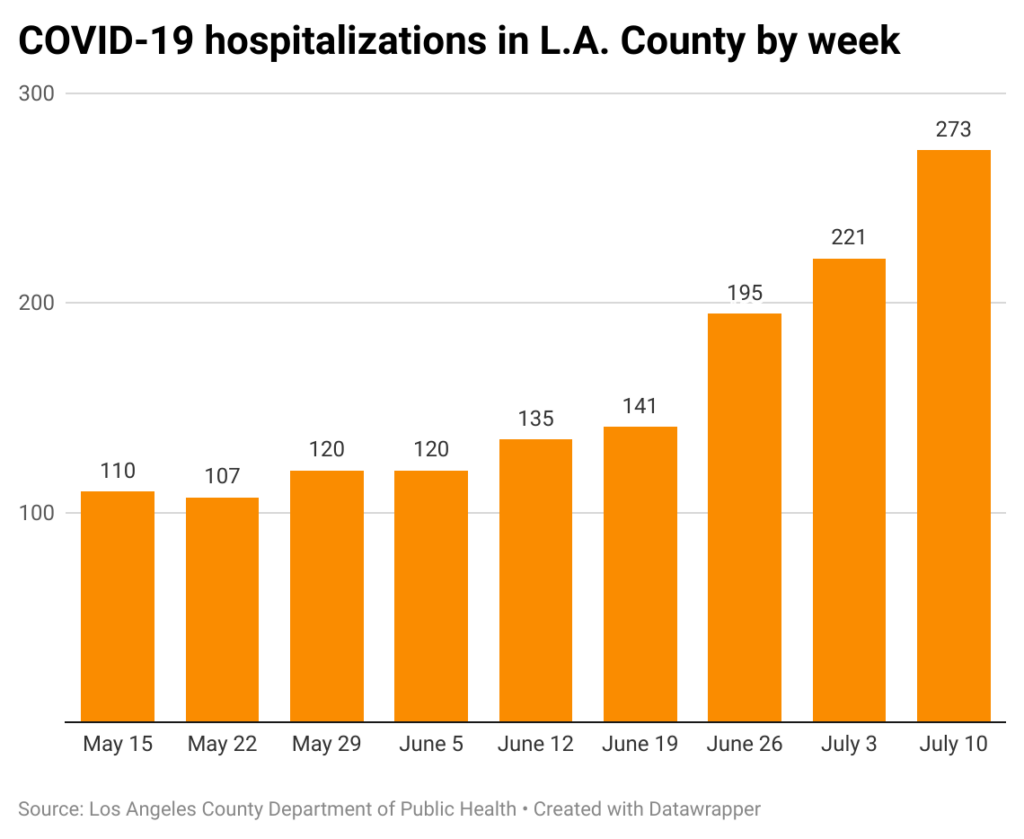
Numbers have generally been low in 2023, but according to the Department of Public Health, the count of hospitalized coronavirus patients has doubled in the past month, from 135 in mid-June to 273 on July 10.
Health officials continue to urge people to get vaccinated, especially seniors and others in high-risk groups. However, relatively few people these days opt to get jabbed.
According to the Department of Public Health’s vaccine dashboard, just 10% of county residents, or 954,000 people, are considered up to date on their coronavirus immunizations.
Altogether more than 23 million doses have gone into arms in the county, but 19.9 million of those were the original version.
How we did it: We analyzed coronavirus data through July 17, 2024, related to new cases, deaths, hospitalizations and vaccinations provided by the Los Angeles County Department of Public Health. The data only reflects cases reported to the department, and not how many cases actually occurred. We also examined wastewater concentration data from the Centers for Disease Control and Prevention.
Learn more about our data here. Any questions? Email askus@xtown.la.


