

The COVID-19 picture brightens in Los Angeles


When the calendar flipped there was concern, if not alarm, about rising COVID-19 metrics in the region. There were 830 hospitalizations on Jan. 10, which was both the highest count in nearly a year, and represented the 10th consecutive weekly increase, according to data from the Los Angeles County Department of Public Health.
Additionally, the coronavirus concentration in the wastewater system was up.
Now the situation has changed, and many key metrics are declining. Hospitalizations have fallen for five consecutive weeks, to 481 people needing advanced medical care as of Feb. 14, according to the Department of Public Health.
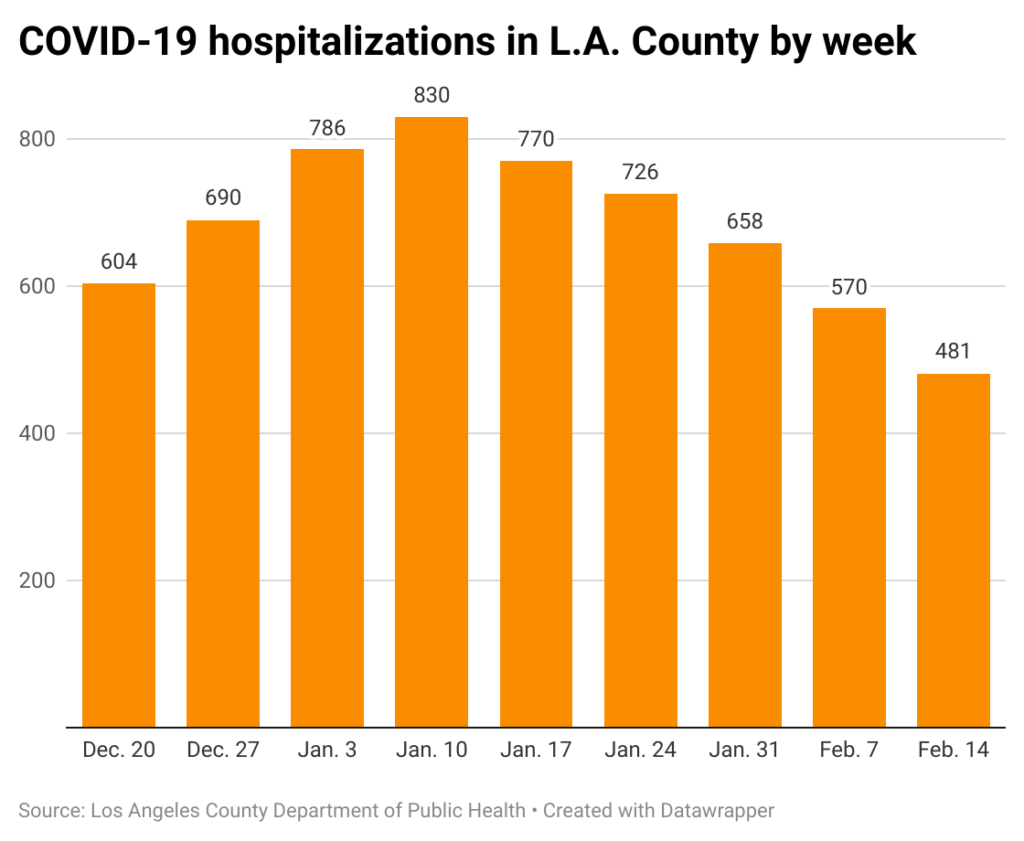
The trend is positive, but of course, everything is relative. Last summer the hospitalization count was in the 200s.
The current moment is nothing like the early stage of the pandemic. According to the California Department of Public Health’s Respiratory Virus Dashboard, on Feb. 3 the state registered 4.7 COVID-19 hospitalizations per 100,000 residents. The count on the same date in 2021 was 36.16 hospitalizations.
Check the water
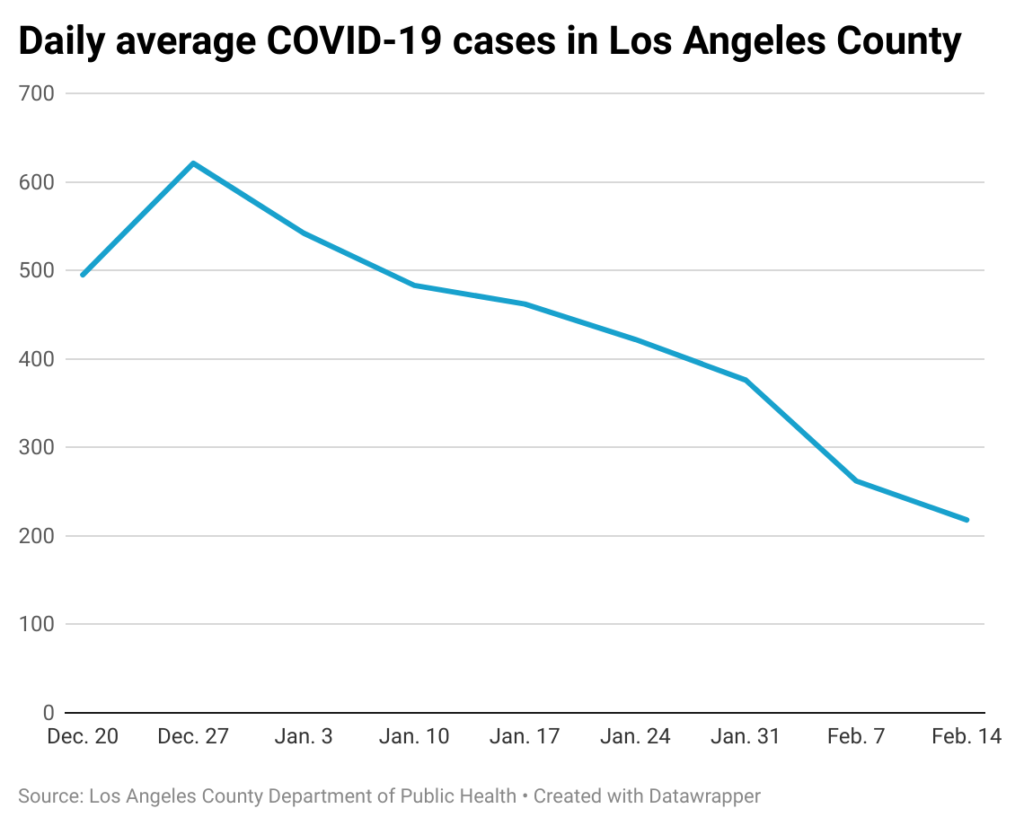
Case counts are not as reliable as they once were, because most infections are not reported to authorities. However, the official figure does provide context as to whether COVID-19 is growing more or less prevalent in the region.
[Get crime, housing and other stats about where you live with the Crosstown Neighborhood Newsletter]
In Los Angeles County the numbers are descending—on Feb. 14 there was a seven-day daily average of 218 diagnosed cases. That represents a 16.8% decline from the previous week.
Wastewater concentrations are deemed a more accurate indicator of spread than cases. That category too is declining. On Jan. 24, according to the Department of Public Health, the concentration was at 67% of last winter’s peak.
On Feb. 14, the figure had fallen to 52% of the previous winter’s high.
“Looking at the overall trend in wastewater data indicates that COVID-19 transmission is declining, but still elevated compared to pre-surge levels,” the department stated in its weekly coronavirus briefing.
While many people now largely overlook COVID-19, there can still be serious impacts. According to state data, from Oct. 1, 2023–Feb. 3, 2024, there were 2,308 COVID fatalities in California. During the same period, health authorities recorded 432 influenza-related deaths.
Vaccines continue to be readily available, even if few people take advantage of them. According to the state’s vaccine dashboard, just 13.1% of California’s population is considered up to date on their shots.
In Los Angeles County, the figure is 11.4%.
How we did it: We analyzed coronavirus data through Feb. 14, 2024, related to new cases, deaths, hospitalizations and vaccinations provided by the Los Angeles County Department of Public Health. The data only reflects cases reported to the department, and not how many cases actually occurred. We also examined county respiratory diseases data and state of California respiratory diseases data.
Learn more about our data here. Any questions? Email askus@xtown.la.


