COVID levels continue to rise in Los Angeles
![]()
An indelible moment of the Paris Olympics was U.S. sprinter Noah Lyles collapsing after completing the 200-meter finals. The heavily favored runner finished third, and soon revealed that he had contracted COVID-19. He ran the race with a 102-degree fever.
Not only was COVID present at the Paris Games, but it remains so in Los Angeles, with several key metrics rising. Although the impact on the healthcare system was much worse early in the pandemic, the highly transmissible FLiRT variants mean many people are still getting sick.
This has been the case for months. In a recent statement the Los Angeles County Department of Public Health declared, “Since mid-May, Public Health has seen consistent increases of reported COVID-19 cases in L.A. County.”
[Get crime, housing and other stats about where you live with the Crosstown Neighborhood Newsletter]
These days most infections are identified with at-home tests, and the results are never shared with health authorities, making caseload an inaccurate indicator of how widespread the coronavirus is in the population. However, the confirmed weekly count does provide context on whether levels are rising or falling.
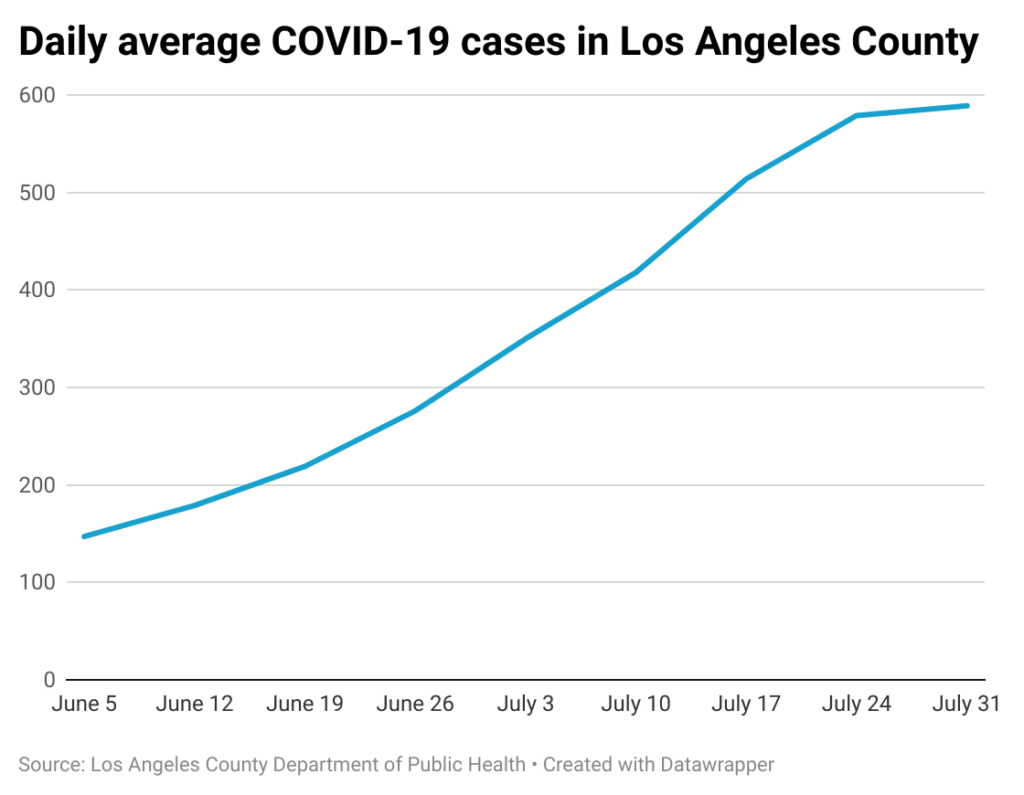
According to the Department of Public Health’s COVID-19 dashboard, on July 31 there was a seven-day daily average of 589 new cases. The count has quadrupled since the start of June.

Medical treatment
Hospitalizations are considered a more reliable reflection of risk in the region. At the worst point in the pandemic, in early 2021, more than 8,000 people with COVID-19 were being treated in area medical institutions.
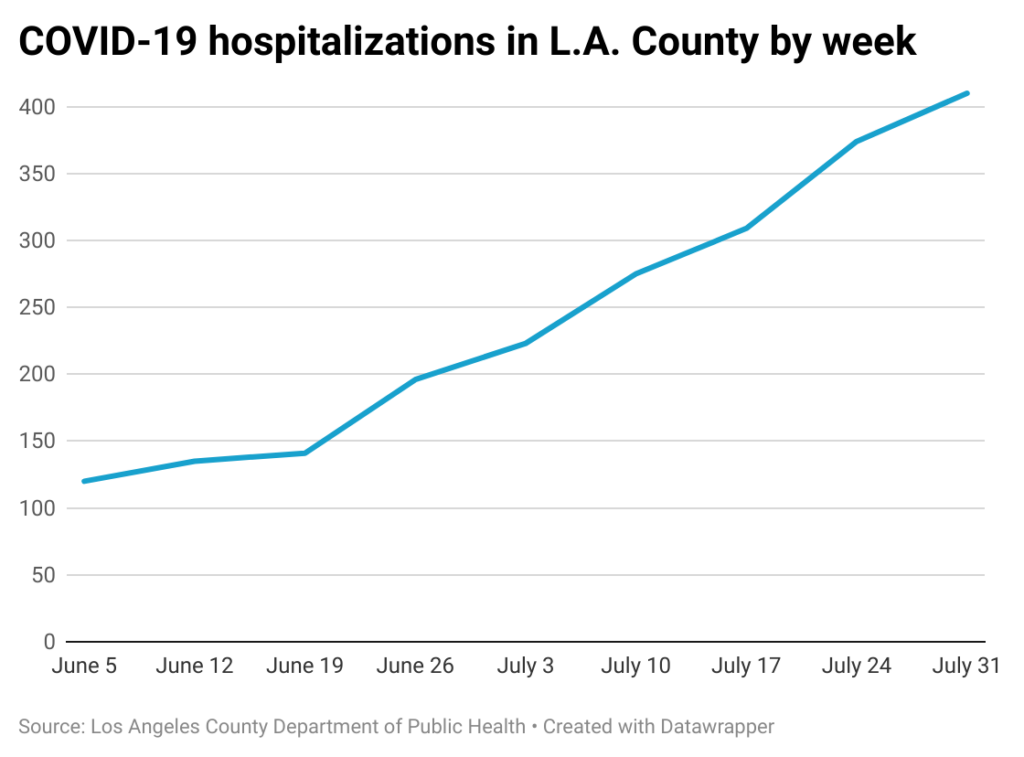
According to the Department of Public Health, there were 410 people hospitalized in the county with COVID-19 on July 31. That marked the eighth consecutive week the count had increased.

Another indicator of current spread is the concentration of coronavirus in the wastewater system. The Centers for Disease Control and Prevention considers the national wastewater viral activity level to be in the “very high” range.
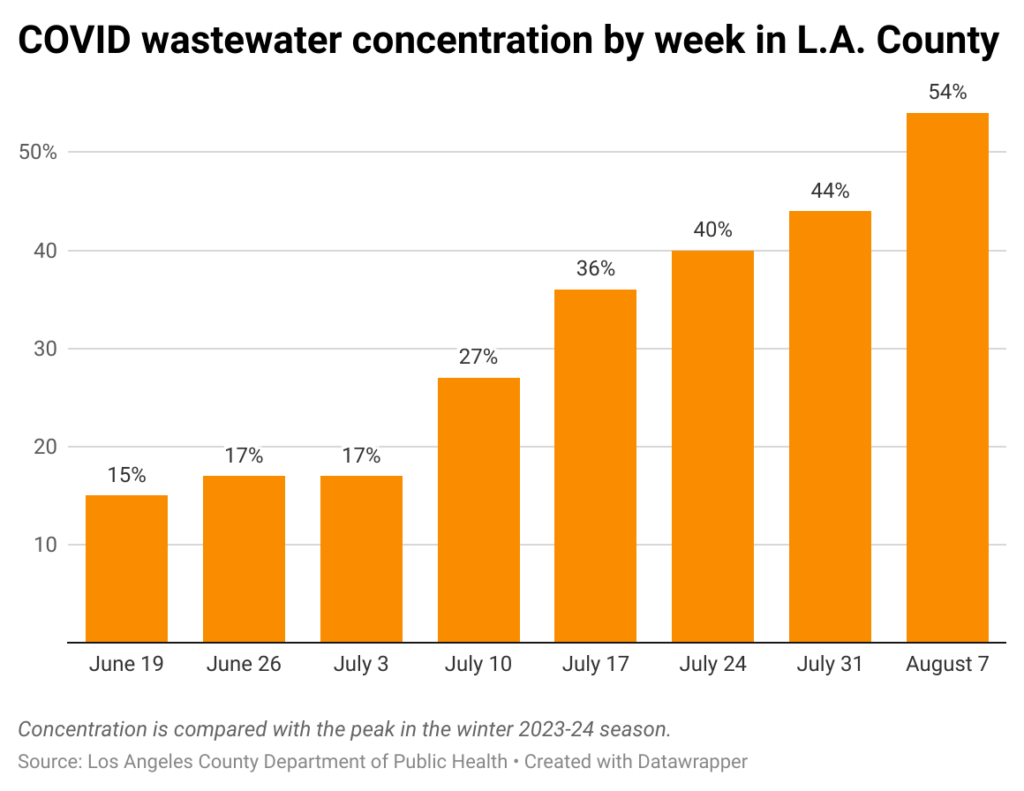
Levels are also up in Los Angeles. In early July, the concentration was at 17% of last winter’s peak, according to the Department of Public Health. That has steadily risen, and on Aug. 7 the concentration had reached 54% of the winter peak.

Although more people are contracting COVID-19, past infections and vaccinations have given many individuals protections from severe illness or death. Still, health authorities warn of the dangers to those who are older or have underlying health risks.
How we did it: We analyzed coronavirus data through Aug. 7, 2024, related to new cases, deaths, hospitalizations and vaccinations provided by the Los Angeles County Department of Public Health. The data only reflects cases reported to the department, and not how many cases actually occurred. We also examined wastewater concentration data from the Centers for Disease Control and Prevention.
Learn more about our data here. Any questions? Email askus@xtown.la.


