

More than half of Los Angeles pool permits go to just 12 neighborhoods


It is no surprise that in Los Angeles, pool construction, like so much else, varies depending on neighborhood. Although the entire city bakes during the summer, certain better-off areas see the most watery respites.
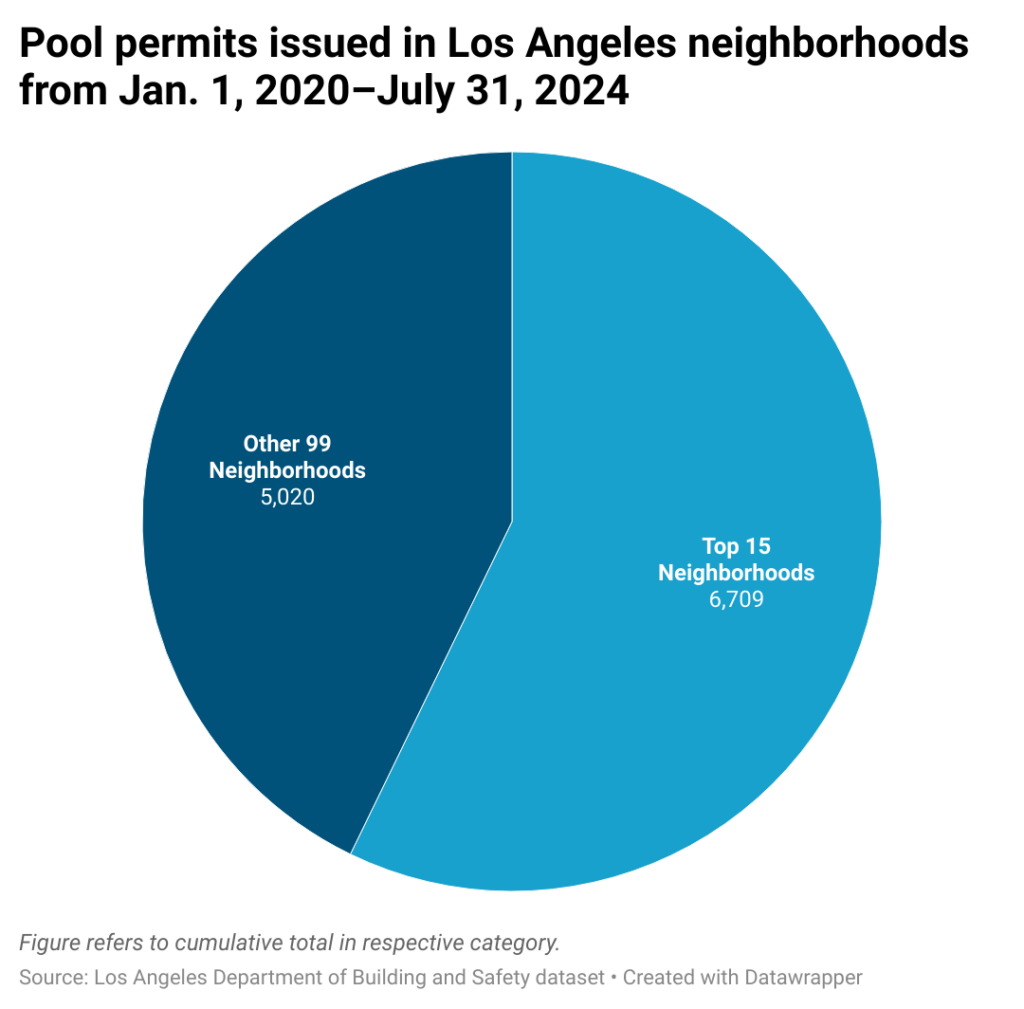
An analysis of permits issued by the city Department of Building and Safety shows that the divide may be even starker than many people realize. The city has 114 neighborhoods. In the period from Jan. 1, 2020–July 31, 2024, a total of 11,729 pool (and spa) permits were issued, according to publicly available department data.
[Get crime, housing and other stats about where you live with the Crosstown Neighborhood Newsletter]
More than half of those were for projects in just 12 neighborhoods on the Westside and in the San Fernando Valley. Add in three additional neighborhoods and the proportion climbs to 57%.
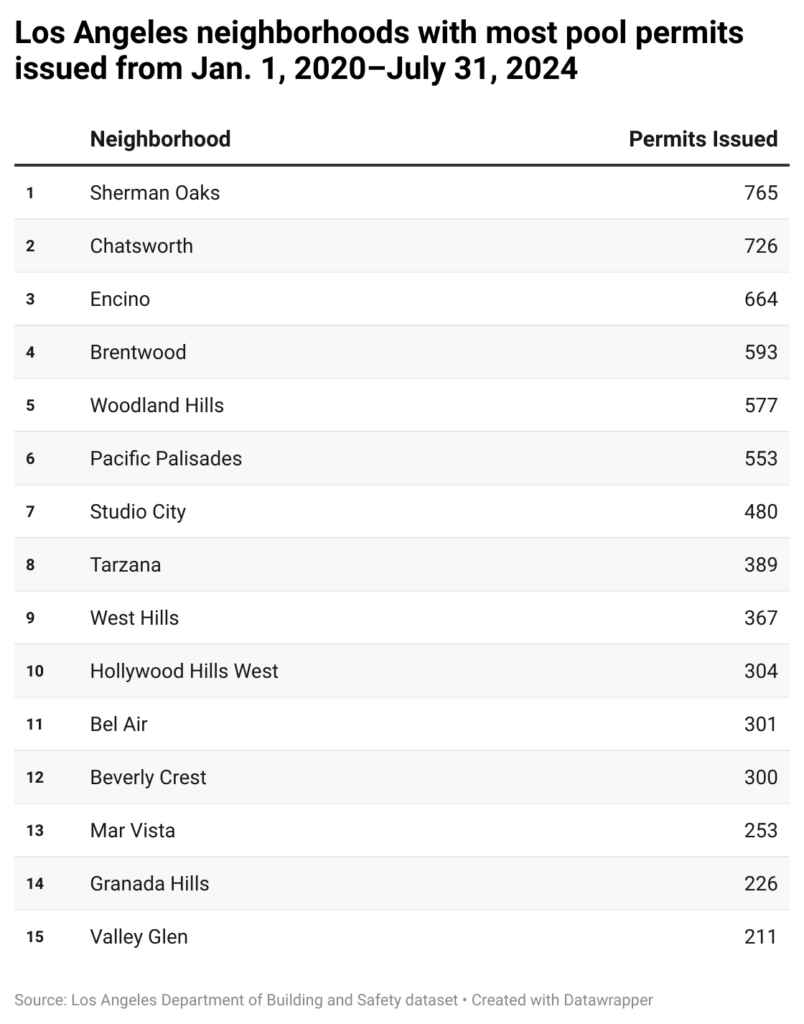
Some of these are enclaves for the wealthiest Angelenos. This includes Brentwood (593 permits issued in the period) and Pacific Palisades (553).
Even more prevalent are less affluent (but still economically comfortable) communities known for single-family homes on large lots. Since 2020, 765 pool permits were issued in Sherman Oaks, more than any other neighborhood (a permit does not guarantee that a pool ultimately gets built). The next highest count is the 726 permits handed out in Chatsworth.
“It’s areas with money,” acknowledged Doran Toledano, the owner of Sherman Oaks-based Aqua Pool and Spa Construction.
Toledano, who has been in the pool business for more than 25 years, said many of his Valley projects are for newly constructed homes, often in gated communities. The residents use the amenity, but there is also a long-term play.
“At the end of the day it’s harder to sell a house in L.A. without a pool,” Toledano said.
Prices and power lines
Factors such as size, location and materials impact the price of building a pool. A variety of local pool construction firms put the cost of an average-sized project in the $80,000–$150,000 range. Elaborate and larger designs can surpass $400,000.
As striking as the permit numbers at the upper end of the spectrum are those at the bottom. A plethora of densely populated neighborhoods in the central, southern and eastern portions of the city see little pool construction.
In the period from Jan. 1, 2020–July 31, 2024, there were nine permits issued for pool projects in East Hollywood. Although Boyle Heights’ population of 76,500 residents (according to L.A. County Department of Public Health data) is similar to Sherman Oaks’ 85,000 inhabitants, the Eastside community recorded just five permits in the period.
Historic South-Central saw two permits in the time frame. Other South L.A. neighborhoods including Florence, Harvard Park and Vermont Vista each had just one permit issued.
Price and income are not the only factors in determining who gets a pool. Lot sizes in the Valley and on the Westside are frequently larger than those in other parts of the city. If a house fills much of the ground space on a parcel, a splash zone may be unfeasible.
Then there are infrastructure challenges. Rules prohibiting the construction of any body of water under a high-power electrical line limits construction in certain neighborhoods, especially those with smaller average lot sizes.
Step back from pandemic peaks
The COVID-19 pandemic initially halted many construction projects. Yet as people spent extended time indoors, numerous home improvement efforts were launched.
Pool development soon skyrocketed, with people tapping into the growing value of their home. “Everyone had money to refi and pull equity out of their house,” said Toledano.
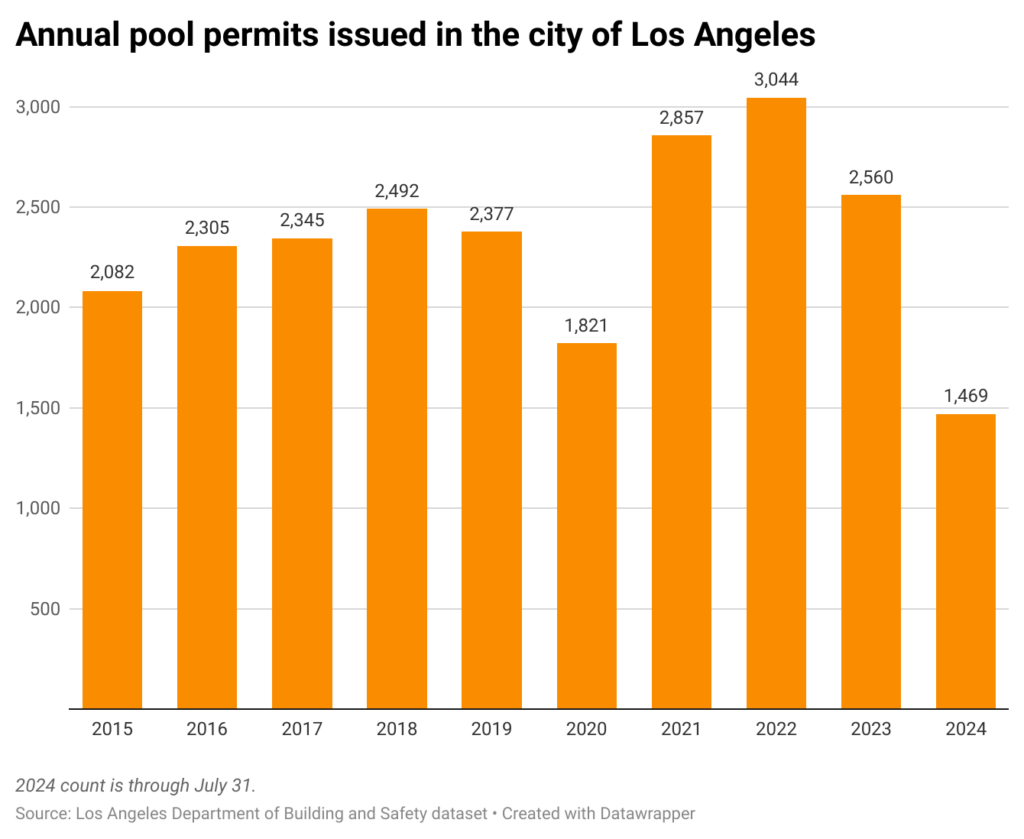
In 2021, a total of 2,857 pool permits were issued in Los Angeles, according to city data. That was the highest level in more than a decade, and the count climbed further in 2022.
The figure declined to 2,560 last year, on par with 2018.
One reason for the pullback may be rising costs. Toledano said the price of construction has doubled since 2017, with materials spiking and inflation a factor.
“Pool plumbing material has gone up at least two to three times,” he said. “Products, labor; we’re literally hit from everywhere.”
Yet a backtrack to a pre-COVID pace is far different from a stop, and Toledano said his company remains busy. The permit activity shows plenty of people are building the quintessential Southern California amenity—just in select neighborhoods.
How we did it: We examined publicly available permit data from the Los Angeles Department of Building and Safety from Jan. 1, 2017–July 31, 2024. In making our calculations, we rely on the data the department makes publicly available. The department may update past permit applications with new information, or recategorize past permits. Those revisions do not always automatically become part of the public database.
Have questions about our data or want to know more? Write to us at askus@xtown.la.


