Pool permits dip in Los Angeles

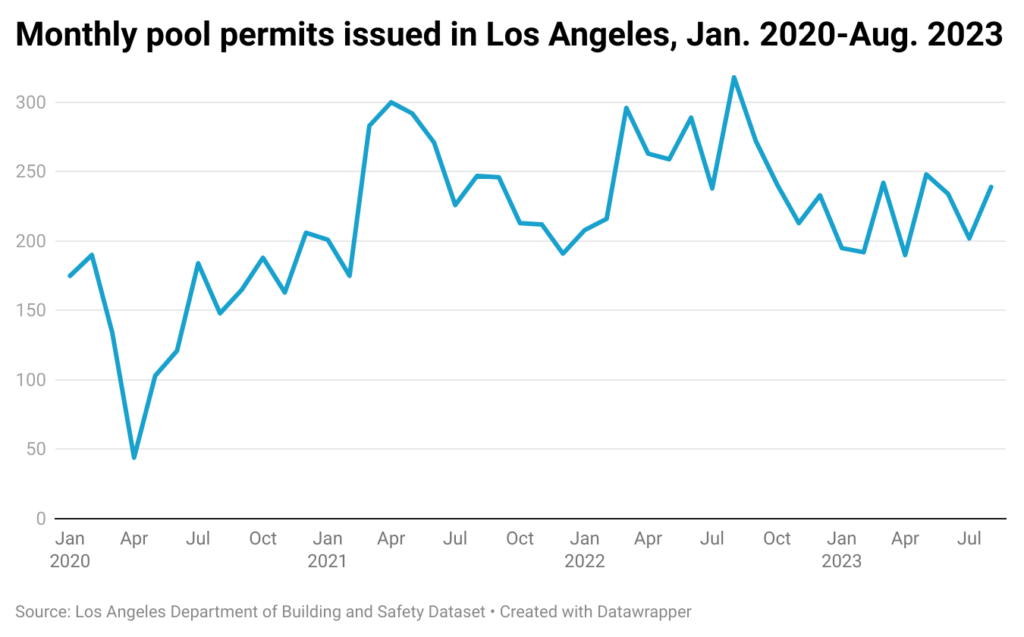
In the spring of 2021, with many people sticking close to home due to the COVID-19 pandemic, pool construction in Los Angeles began soaring. The situation repeated itself in the warm months of 2022.
This year, interest in backyard swimming has dipped. In August, the city Department of Building and Safety issued 239 permits for pool or spa construction, down from 318 in the same month last year. The monthly high for permits in 2023 is the 248 handed out in May. In 2022 that was exceeded in six different months.

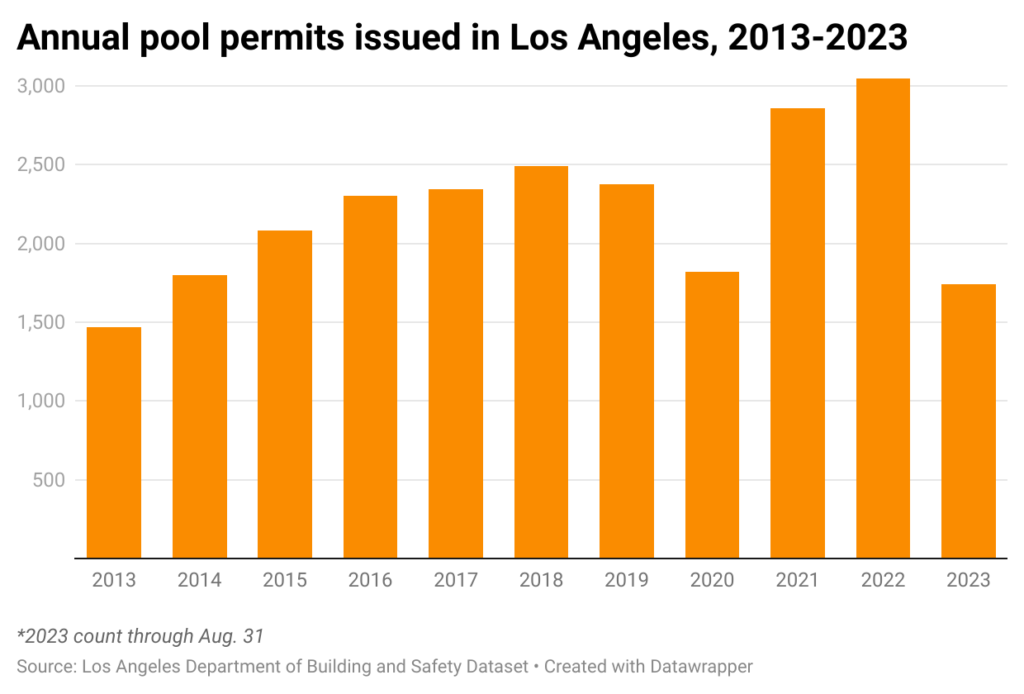
According to publicly available Department of Building and Safety data, 1,742 permits were issued for new pool construction from Jan. 1–Aug. 31. That’s a 17% drop from the same period in 2022. This year the city is on pace to issue approximately 2,500 permits, which would be in line with annual pre-pandemic levels.

John Norwood, the director of government relations at industry group the California Pool and Spa Association, said that this year, “Maybe demand has caught up a bit.” He noted that another reason for the decline could be higher interest rates for home equity loans.
Still, he said that a desire remains in a region known for triple-digit temperatures—something that occurred again last week.
“Polls continue to indicate that homeowners dream of a home with a big backyard and a pool,” he said.
[Get crime, housing and other stats about where you live with the Crosstown Neighborhood Newsletter]
Dollars and delays
According to Department of Building and Safety data, nearly 97% of the pool construction permits are issued for single-family homes. The remainder are for apartment and condominium buildings, or commercial projects.
It is worth noting that while securing a permit indicates interest and intent, not every project reaches the finish line. One factor could be cost: Norwood put the current average price of an in-ground pool in Los Angeles at around $100,000, with elements such as materials and size driving the figure up or down. Then there are maintenance and utility costs.
The pandemic demand had an impact. In August 2022, NBC Los Angeles reported that the cost of materials in pool projects, like many other home improvement efforts, had skyrocketed. This resulted in some projects being delayed, postponed or canceled.
It is difficult to determine precisely how many pool projects reach the finish line. Planning and construction can take from several months to years. Department of Building and Safety data shows that from Jan. 1, 2022–Aug. 31, 2023, a total of 4,788 permits were issued in the city. During that same period, the department handed out 3,074 certificates of occupancy for pool projects. Of course, many of those were for projects that were permitted in 2021 or before, while a number of pools with more recent permits are still being worked on.
Unequal distribution
Although a backyard pool is the dream of many Southern California residents, there has long been a sharp discrepancy between which neighborhoods get them, and where people have to hope there is a city recreation center with a pool, or another public option.
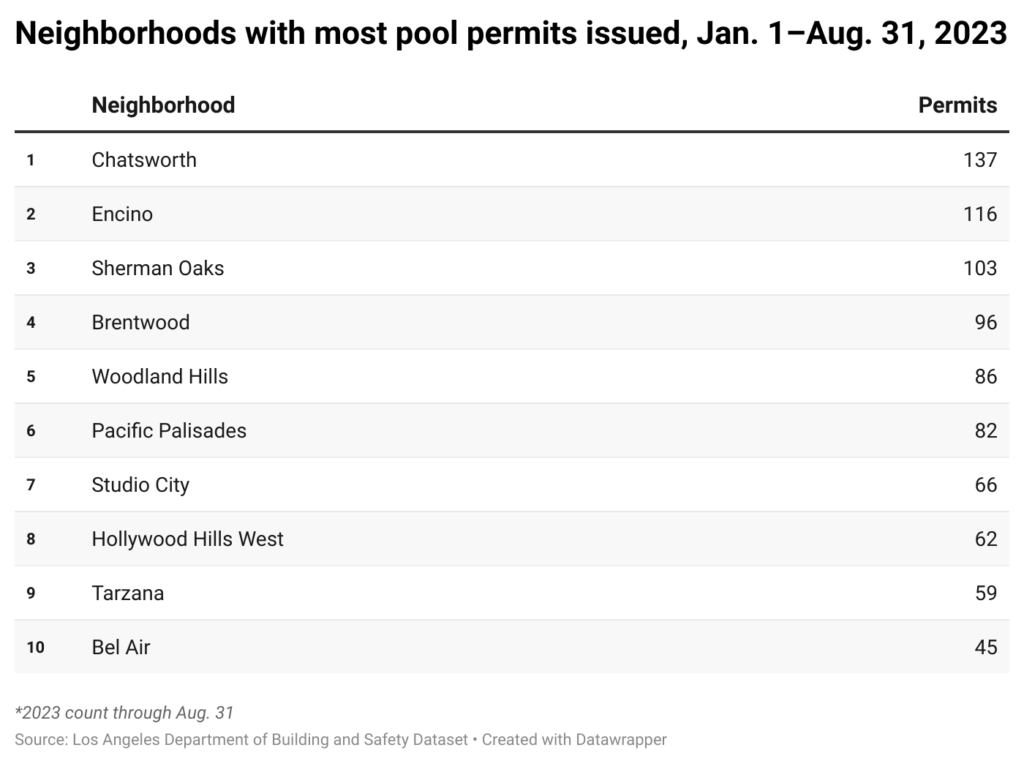
It is no surprise that middle- and upper-income areas with large lots see the most pool construction. According to Department of Building and Safety data, 137 pool permits were issued in Chatsworth in the first eight months of 2023, more than any other neighborhood in the city. The communities with the next highest counts were also in the San Fernando Valley: Encino (116 permits) and Sherman Oaks (103).

The affluent Westside is another popular area. There were 96 pool construction permits issued in Brentwood from Jan. 1–Aug. 31, and 82 in Pacific Palisades.
Meanwhile, lower-income neighborhoods often see few permits. This could stem not only from household income, but also smaller lots or areas where high-power lines run over the property (pools cannot be built under electrical cables).
Nine Los Angeles neighborhoods have had just one permit this year. They include Westlake, Lincoln Heights and Vermont-Slauson.
In other communities, not a single pool permit has been issued in 2023.
How we did it: We examined publicly available data from the Los Angeles Department of Building and Safety from Jan. 1, 2008–Aug. 31, 2023. Learn more about our data here.
In making our calculations, we rely on the data the Department of Building and Safety makes publicly available. On occasion, their department may update past permit applications with new information, or recategorize past permits. Those revised permits do not always automatically become part of the public database.
Have questions about our data or want to know more? Write to us at askus@xtown.la.


