

After a summer spike, COVID counts begin to fall


This summer, Los Angeles experienced the most substantial COVID-19 spread in more than a year (including in this journalist’s household). But a peak appears to have been hit, and as fall arrives, key metrics are trending down again.
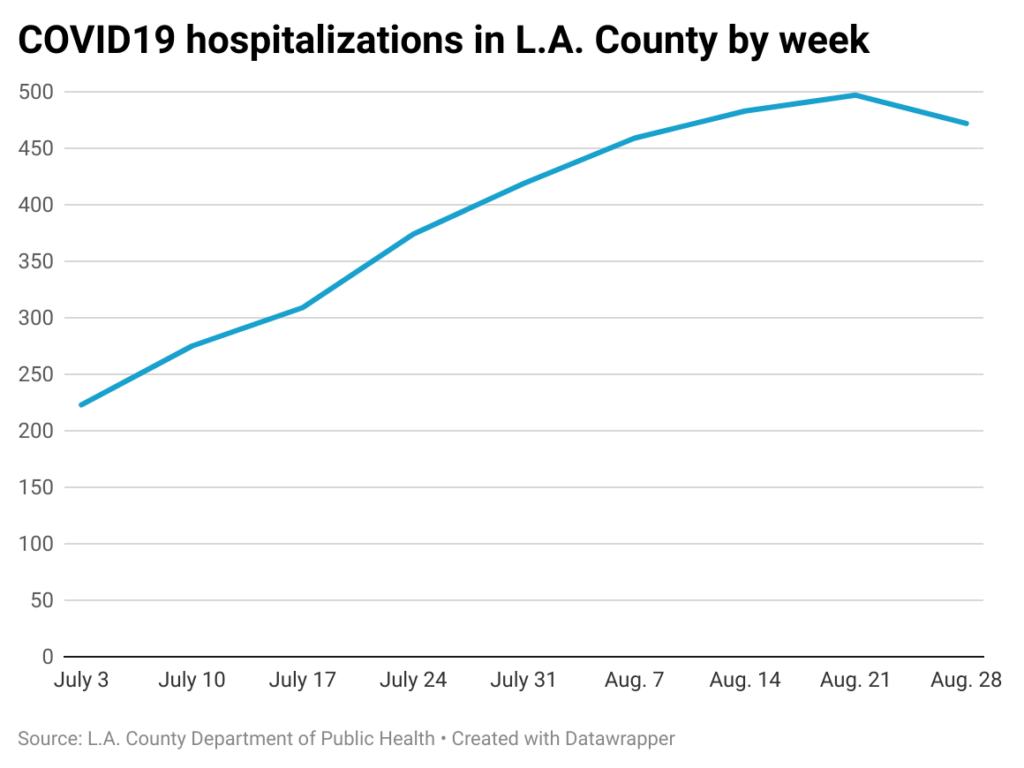
Among the most significant is the number of people hospitalized with COVID-19. Starting in early June, the figure rose for 11 consecutive weeks, more than quadrupling to 497 hospitalizations on Aug. 21.
[Get crime, housing and other stats about where you live with the Crosstown Neighborhood Newsletter]
Yet a week later, the figure stood at 472 hospital patients, according to data from the Los Angeles County Department of Public Health (September figures are not yet available).
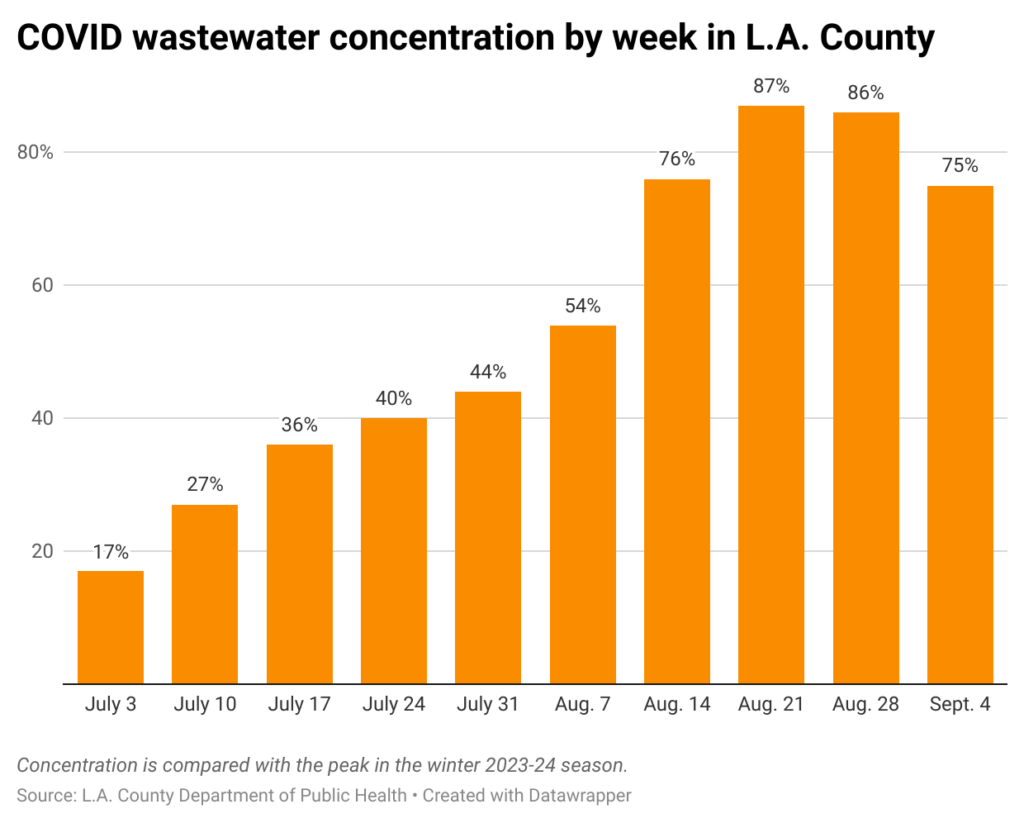
Also decreasing is the concentration of coronavirus in the wastewater system. On July 3, according to the Department of Public Health, the level was at 17% of last winter’s peak. That escalated in the following months, reaching 87% of the winter peak on Aug. 21.
On Sept. 4, the concentration had declined to 75% of the winter 2023-24 peak, according to Department of Public Health data.
Although numbers are going in a positive direction, points of concern remain, and people continue to get sick. The Centers for Disease Control and Prevention classifies the wastewater concentration level in California as in the High range.
Taking tests
Most COVID-19 tests are conducted at home and never reported to health authorities. Stll, changes in the positivity rate can reflect the spread of the coronavirus across the greater community. That was seen with the FLiRT variant that was dominant over the summer. In early June, the positivity rate was below 5%, but then began rising, reaching a peak of 13.8% on Aug. 3.
The level has since gone down. On Sept. 1, the rate stood at 11.45%.
As with testing, cases are no longer considered to be fully reliable, as many infections that are detected with home tests, or that produce only minor symptoms, are never identified to health authorities. Still, the weekly public count is considered reflective of overall trends.
Cases too are on the decline. On Aug. 28, there was a daily average of 490 infections countywide, according to the Department of Public Health. The peak had been reached three weeks earlier, with an average of 645 cases.

Updated versions of the COVID-19 vaccine were approved by the FDA last month, and are now available. They come after a year of tepid response. According to the Department of Public Health’s vaccine dashboard, only about 10% of L.A. County’s 9.8 million residents received the previous vaccine.
How we did it: We analyzed COVID-19 data through Sept. 4, 2024, related to new cases, deaths, hospitalizations and vaccinations provided by the Los Angeles County Department of Public Health. The data only reflects cases reported to the department, and not how many cases actually occurred. We also examined wastewater concentration data from the Centers for Disease Control and Prevention.
Learn more about our data here. Any questions? Email askus@xtown.la.


