

A mixed picture for car thefts in Los Angeles


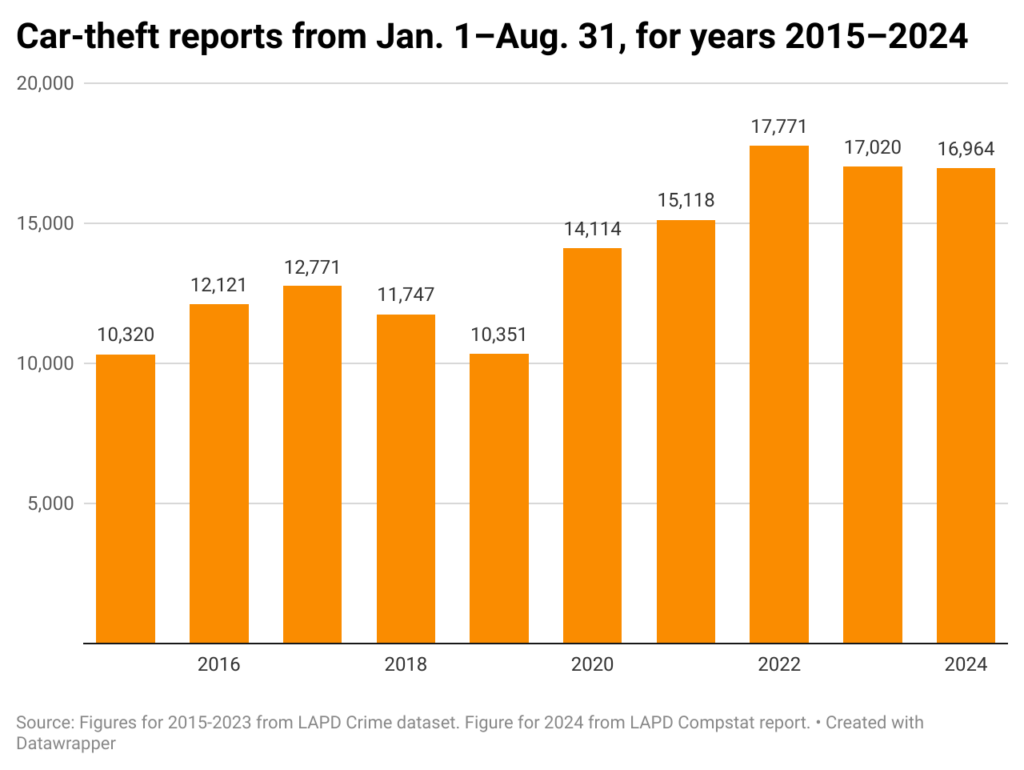
Car thefts continue to be a problem in Los Angeles. In the period from Jan. 1–Aug. 31, there were 16,964 stolen-vehicle reports in the city, which is 56 fewer than in the same period last year. The count is 4.5% below the more-than 17,700 incidents in 2022.
Go back further, however, and the picture is completely different. The 2024 figure marks a 12.2% increase over the stolen-vehicle count in the first eight months of 2021. It is an astonishing 64% higher than the 10,351 reports from Jan. 1–Aug. 31, 2019, according to publicly available LAPD crime data.
Car thefts nationwide began climbing after the onset of COVID-19. Initially thieves were targeting vehicles that sat for extended periods on the street. Yet even as the pandemic eased and people resumed old driving habits, counts never declined significantly.
[Get crime, housing and other stats about where you live with the Crosstown Neighborhood Newsletter]
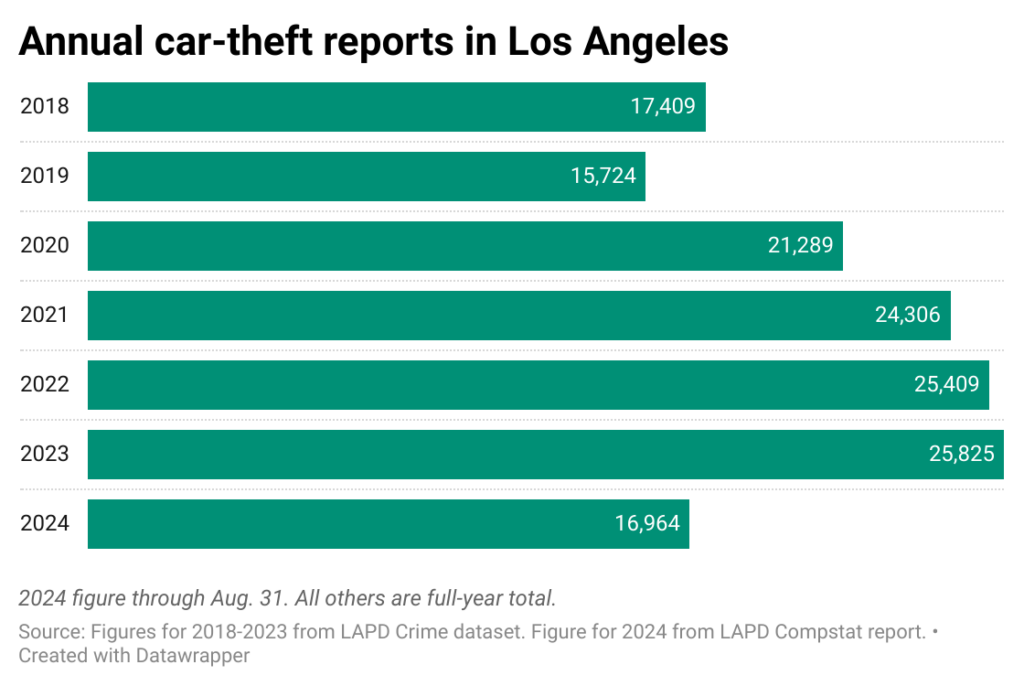
Last year the city recorded 25,825 vehicle thefts. That was the highest total since 2006, according to state Attorney General records.
New reporting system
This spring, the LAPD began a major shift in how it gathers and presents crime data. The change was spurred by an FBI requirement for police departments across the United States to adopt the National Incident-Based Reporting System (or NIBRS). The change from the department’s Summary Reporting System (SRS) meant that publicly available data portals would either go dark or be limited as the new system was implemented.
Much of the work has been completed, and last month the department’s weekly Compstat reports went back online. While figures for categories such as robberies, burglaries and aggravated assaults utilize a mix of the new and old systems, the Compstat page says that department limitations mean stolen vehicles are tabulated using just the SRS.
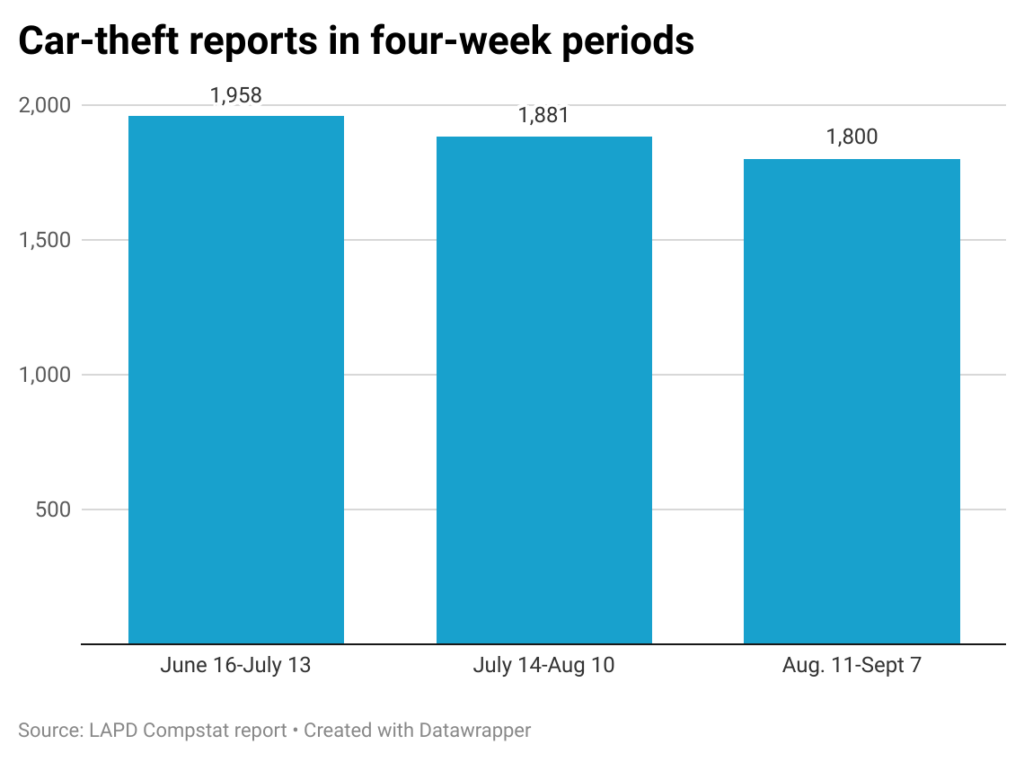
The updated Compstat presentation uses four-week blocks to discern crime trends, and car-theft numbers have recently declined. From Aug. 11–Sept. 7 there were 1,800 reports. That’s 4.3% below the previous four weeks, and down 8% from the period before that.
One driver of the nationwide increase was a social media trend that showed how to overwhelm the ignition system of certain Kia and Hyundai models. The automakers responded with software fixes, and the LAPD has been part of anti-theft events, such as one in May in Eagle Rock, where vehicle owners can get free system updates.
During the Sept. 10 meeting of the Los Angeles Police Commission, interim LAPD Chief Dominic Choi said some progress has been made.
“The profiles of the vehicles that are being stolen still remain consistent, with Kias, Chevys and Hyundais,” being the most frequently targeted brands, Choi said. “But we’ve seen a significant drop in the Kias and Hyundais.”
Recoveries and damaged vehicles
Most stolen cars are recovered within a few days, and often not far from where they went missing. According to a report from the California Highway Patrol, of the 202,802 vehicles reported stolen in the state in 2023, 85.8% were successfully recovered.
The report adds that about 52% of recovered vehicles were intact and drivable, with 36% wrecked or intentionally burned. The remainder had varying degrees of damage.
In the wake of the change in reporting systems, the city’s crime data page tabulates about 94% of the stolen-vehicle reports identified in the Compstat figure. This makes it difficult to have a definitive count of incidents in individual neighborhoods.
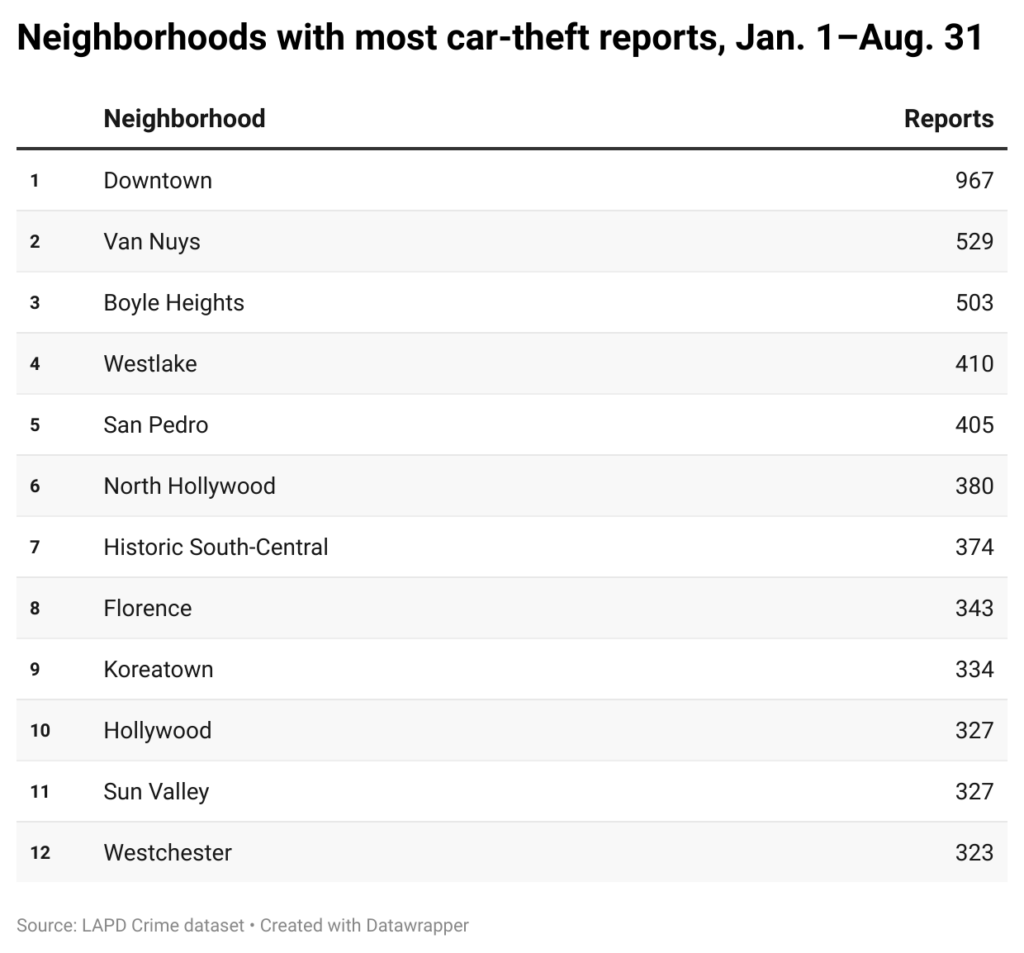
Yet there are reliable estimates, and not surprisingly, populous communities experience the most thefts. From Jan. 1–Aug. 31, there were approximately 967 vehicles stolen in Downtown.
A distant second is Van Nuys, with 529 stolen vehicles. Altogether 12 neighborhoods each registered more than 300 car-theft reports in the first eight months of 2024.
Still, cars are stolen in nearly every community in Los Angeles. From Jan. 1–Aug. 31, 57 neighborhoods registered at least 100 vehicle-theft reports.
Even the most well-off areas are victimized. In the first eight months of the year there were 45 car-theft reports in Hancock Park, 29 in Brentwood and 17 in Pacific Palisades.
How we did it: We examined publicly available crime data from the Los Angeles Police Department from Jan. 1, 2010–Aug. 31, 2024, as well as LAPD Compstat data. LAPD data only reflects crimes that are reported to the department, not how many crimes actually occurred. In making our calculations, we rely on the data the LAPD makes publicly available. LAPD may update past crime reports with new information, or recategorize past reports. Those revised reports do not always automatically become part of the public database.
Have questions about our data or want to know more? Write to us at askus@xtown.la.


