

When it comes to COVID cases, Los Angeles had a year of peaks and valleys


This is one in a series of Crosstown stories looking at the impact of COVID-19 in Los Angeles over the past year. Previous installments focused on deaths in the area and the progress on vaccinations.
Throughout March, the number of new COVID-19 cases in Los Angeles County has tumbled, and the level in recent weeks is the lowest since early in the pandemic. However, the year in between has seen a series of horrifying peaks and valleys that may have lulled the populace into a false sense of security.
As of Sunday, the Los Angeles County Department of Public Health had identified 1,218,225 cases of COVID-19. The distribution has not been even.
In April 2020, the first full month that the novel coronavirus was being thoroughly tracked, there were 22,348 new cases in the county. A surge came in July, after a spate of restrictions on businesses were relaxed, and 77,871 cases were diagnosed.
New COVID-19 cases by month in Los Angeles County
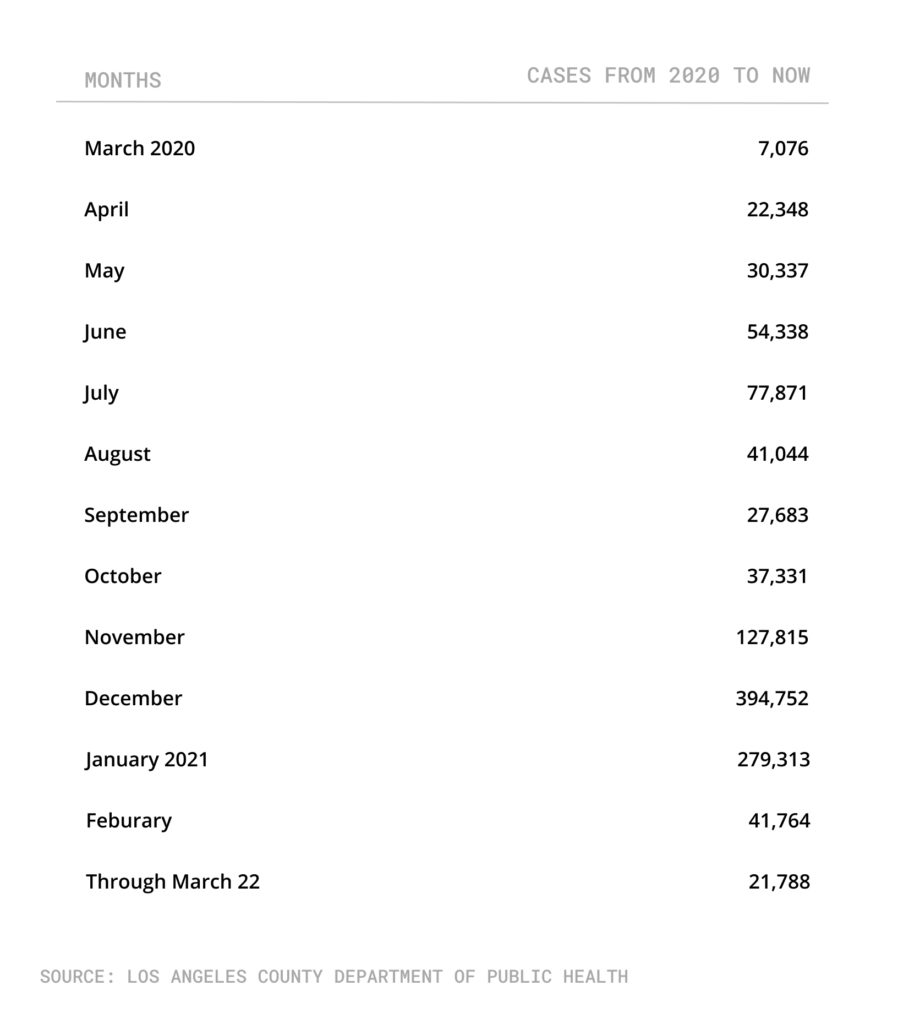
Numbers then fell precipitously, but as fall and winter arrived, the region experienced its worst surge, likely due to factors including colder weather, an increase in indoor gatherings and the arrival of a more contagious California coronavirus variant. The 37,331 new cases in October increased more than tenfold in December, when there were nearly 400,000 new cases.
“It’s hard to believe that a year has gone by,” Mayor Eric Garcetti said during his video briefing on March 15, the one-year anniversary of when he first ordered the closure of many businesses in the city. “Back then we didn’t know the scope of the crisis ahead.”
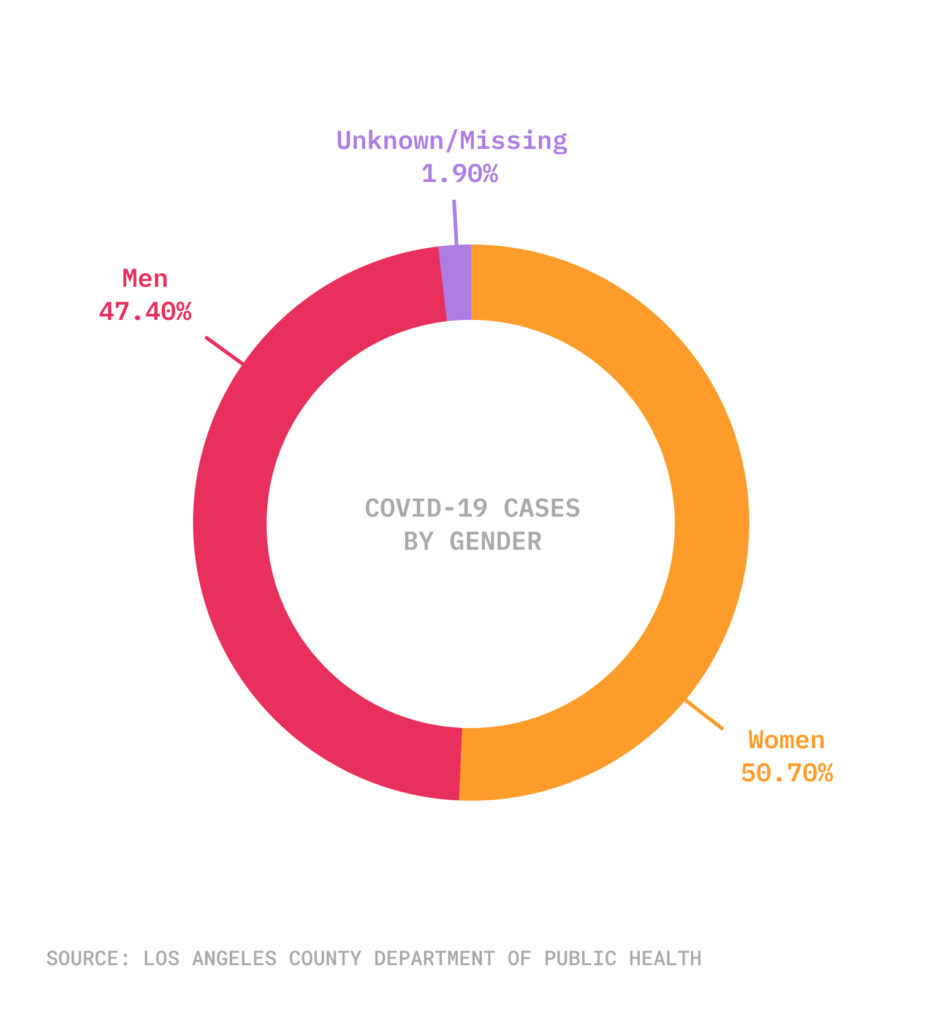
Although far more men than women have died of complications from COVID-19—58.8% of the fallen are men, and 41.2% are women—the case dispersion is more equal. In fact, women represent 50.7% of the cases diagnosed, surpassing the 47.4% of males who contracted the disease (the gender in 1.9% of cases is unknown).
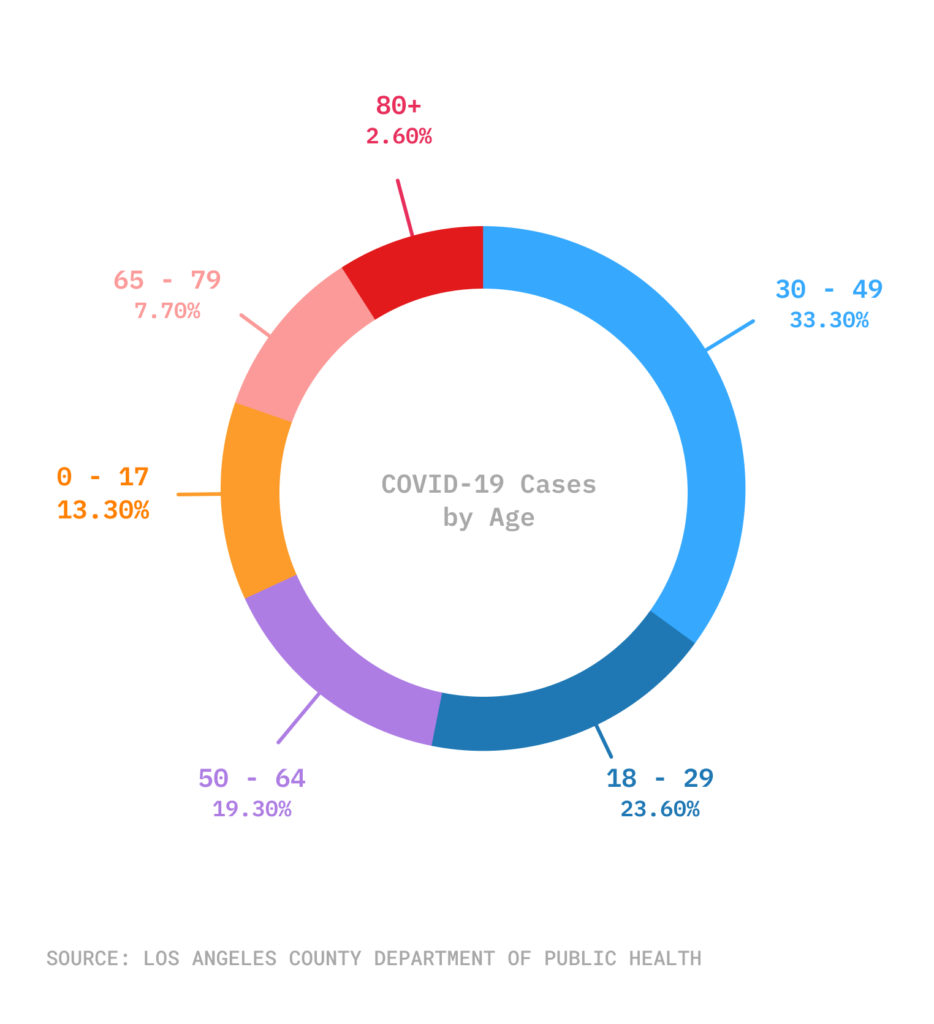
There is also a divide between deaths and case numbers when it comes to age. More than 70% of the people who have died from COVID-19 were 65 or older, with many of them succumbing early on when the virus raced through nursing homes and other congregate care facilities. Yet people 65 and older make up only 10.3% of the total cases, according to County Public Health Department data.
People aged 30-49 account for 33.3% of cases, the highest proportion of any age group. Individuals who are 18-29 make up 23.6% of those who have contracted the virus.
Distribution of COVID-19 cases by age in Los Angeles County
There has also been a disproportionate impact across ethnicities. According to data prepared by Garcetti’s innovation team and available on the daily coronavirus data package he makes public, Latinos in Los Angeles County represent 63.8% of the known COVID-19 cases, although they make up less than 50% of the population. White people, who account for about 27% of the county population, comprise 13.3% of infections (figures could change, as ethnicity is unknown for 22% of the total cases).
With 12,110 cases per 100,000 residents as of March 24, Los Angeles County ranks 37th out of 584 counties with a population greater than 100,000, according to Garcetti’s office, based on data supplied by the County Department of Public Health and Johns Hopkins University.
How we did it: We examined data from March 2020-March 2021 provided by the Los Angeles County Department of Public Health and data documents produced by the office of Mayor Eric Garcetti. In some cases information may have changed from what was originally published.
Have a question? Email askus@xtown.la.


