

With COVID-19, Los Angeles is a tale of two timeframes


With Labor Day here and fall approaching, Los Angeles is seeing a slow but steady drop in coronavirus numbers. The seven-day average case rate decreased by 14.4% from Aug. 25-Sept. 1. Hospitalizations fell from a recent high of 1,790 on Aug. 19 to 1,537 on Sunday.
The declining numbers also provide an opportunity to look back at just how severe the summer surge truly was, and how a period that many hoped would bring a return to normal was felled by the double whammy of relaxed restrictions and the rampaging Delta variant.
In the two-month period from April 16-June 15—right before California and Los Angeles County allowed most businesses to fully reopen—there were a total of 18,257 new coronavirus cases reported by the Los Angeles County Department of Public Health. In the following two-month period, from June 16-Aug. 15, there were 105,759 new cases, a 465% increase.
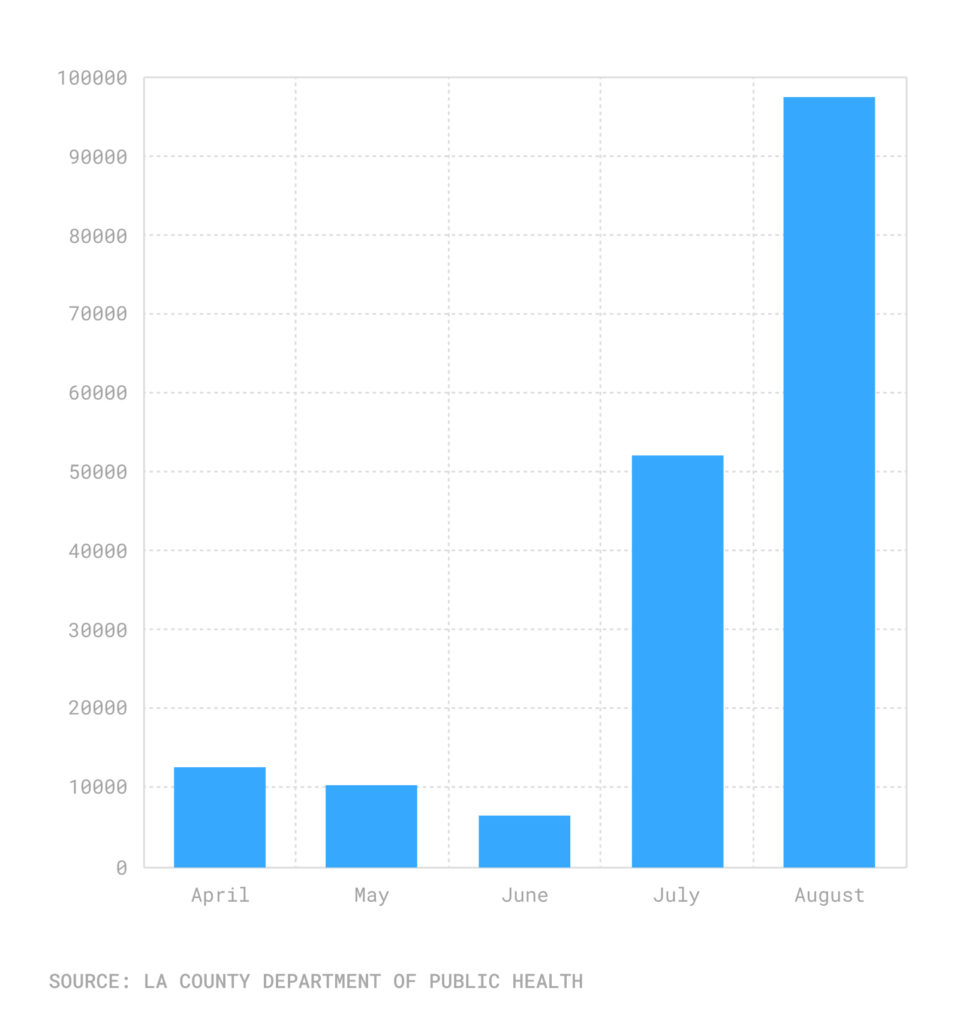
In June, the County saw just 6,463 new cases. The tally in August was more than 16 times as high—103,841 infections.
Monthly new COVID-19 cases in Los Angeles County, April-August
The impact has not been evenly felt across Los Angeles. During the initial part of the summer spike, some of the highest numbers of new cases occurred in relatively affluent communities, among them South Pasadena and Bel-Air. That has changed in the past month, with more infections diagnosed in lower-income neighborhoods, including East Los Angeles and Historic South-Central.
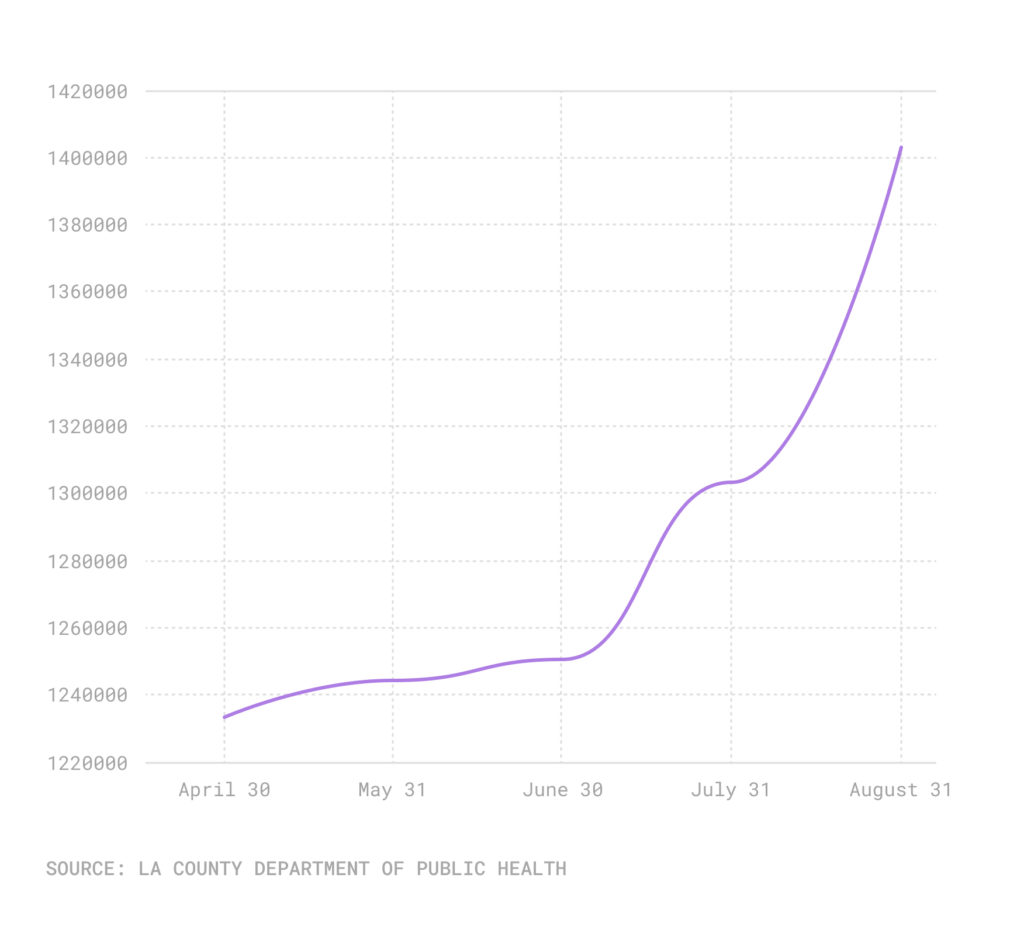
Altogether more than 1.4 million people in L.A. County have contracted COVID-19.
Cumulative COVID-19 cases in Los Angeles County, through Aug. 31
The level of hospitalizations also varied significantly in the period before and after the reopening. On April 15, a total of 518 people in local hospitals were being treated for COVID-19, and on June 15 the figure had fallen to just 218. Then the rise began; on July 15, there were 406 people hospitalized. On Aug. 15, the impacts of the Delta variant were undeniable, with 1,650 coronavirus patients in the region’s hospital wards.
Not surprisingly, the positivity rate saw a similar shift. Throughout much of the spring the rate was under 1%, landing at 0.3% as recently as June 7. But on Aug. 3, the rate peaked at 6.6%.
The number of deaths reflects the lag between the time people contract COVID-19, and when they need hospital care or pass away. From April 16-June 15, there were 795 deaths. Many of those who perished had actually been infected during the winter, when new cases were significantly elevated. From June 16-Aug. 15, there were 477 deaths.
However, death counts are now increasing again, with the Department of Public Health frequently reporting 30 or more deaths in a day. There were 43 deaths last Thursday, and 39 deaths on Aug. 24.
The message from health experts is consistent: Vaccinations can change the course of the disease. In a statement on Saturday, County Director of Public Health Dr. Barbara Ferrer called inoculations a “game changer.”
“Among the nearly 5.3 million fully vaccinated people in L.A. County, less than 1% of all those vaccinated have become infected with COVID-19, only 0.02% of those who tested positive were hospitalized,” Ferrer said. She added, “among all fully vaccinated people, death from COVID is exceedingly rare with 0.0022% having passed away.”
How we did it: We analyzed coronavirus data related to new cases, deaths, hospitalization and vaccinations data from April 1-Sept. 5 provided by the Los Angeles County Department of Public Health.
Interested in our data? Check out the Crosstown coronavirus interactive map or email us at askus@xtown.la.


