The Crosstown COVID Tracker
![]()
The local surge in Omicron cases has peaked, and many COVID-19 metrics, including case numbers and hospitalizations, are rapidly declining.
Deaths, on the other hand, continue to remain at an alarming level.
Meanwhile, regional health and political leaders continue to urge vaccinations and safety precautions. That includes a Wednesday announcement about mask requirements at the Feb. 13 Super Bowl in Inglewood’s SoFi Stadium.
The Crosstown COVID Tracker helps you stay up to date on the latest and most important data on infections, inoculations and general risk. Information on cases in individual communities is available on the Crosstown coronavirus interactive map.
Improving outlook
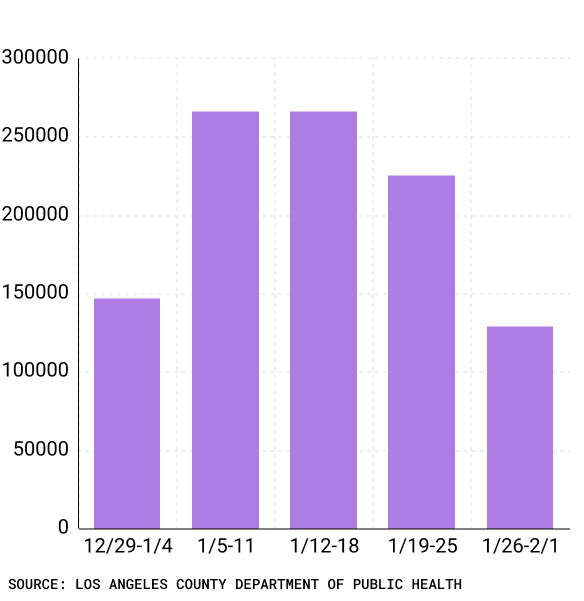
On Wednesday, the Los Angeles County Department of Public Health reported 15,664 new COVID-19 cases. That brings the seven-day average to 17,645, a 42.9% decrease from the average one week prior.
COVID-19 cases in Los Angeles County, Dec. 29-Feb. 1

The average daily case rate saw a similar decline, with 193 positive cases per 100,000 residents from Jan. 25-31. That is a 38% decrease from the 311 positive cases per 100,000 residents one week before.
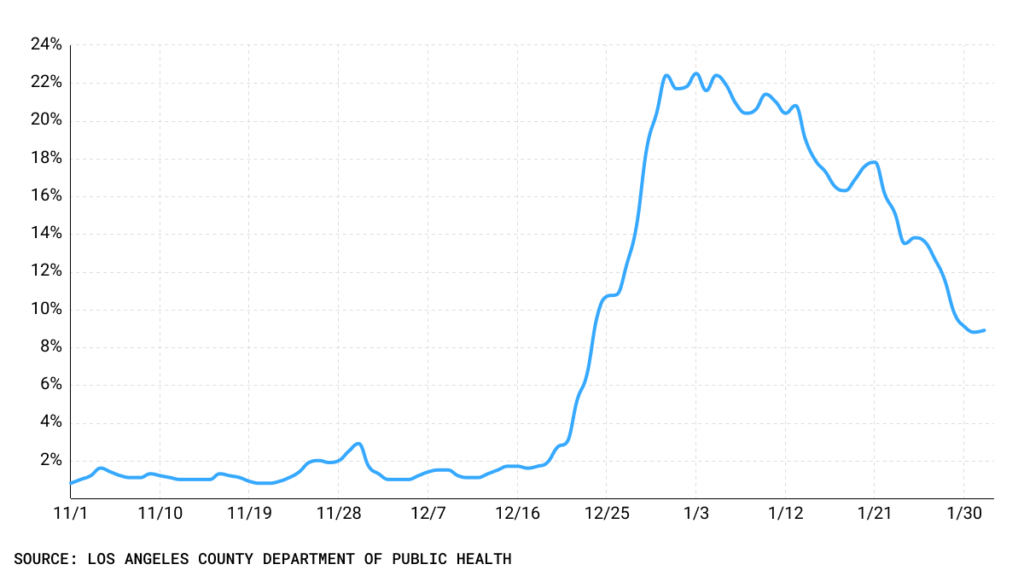
The positivity rate also continues to tumble, reaching 8.8% on Wednesday, down from 13.6% the previous week. This time last year, the positivity rate was 10%.
Positivity rate in Los Angeles County, Nov. 1-Jan. 31

The Los Angeles Unified School District also continues to see lower case numbers since schools opened nearly a month ago. From Jan. 26-Feb. 1, 346,669 tests were given to students and staff, with about 13,000 positive results, a 3.86% positivity rate. That is down from 6.48% last week and 8.1% two weeks ago. In the week ending Jan. 11, the positivity rate was 13%.
[Get COVID-19, crime and other stats about where you live with the Crosstown Neighborhood Newsletter]
Serious conditions
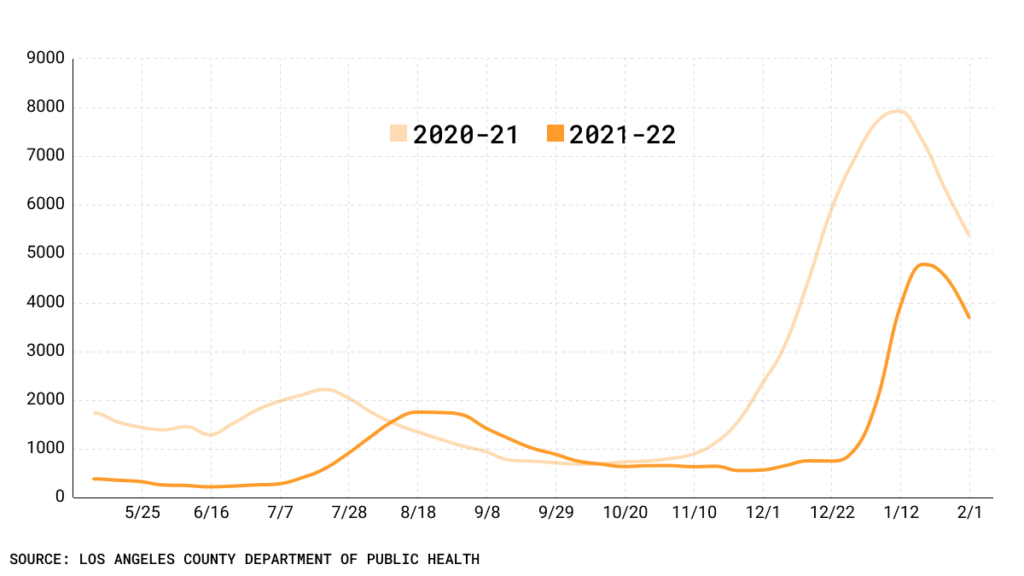
Los Angeles County hospitalizations are also declining. On Wednesday, 3,515 people in the county were hospitalized with COVID-19, a 22.5% decrease from the previous week. This time last year, there were 5,165 COVID-19 patients in area hospitals.
Coronavirus hospitalizations in Los Angeles County

Still, deaths remain high, a result of the case spike that began in December. On Wednesday, the county reported 102 COVID-19 fatalities, the highest daily toll since last March. The seven-day average of deaths reached 68 on Wednesday.
While the number of deaths is higher than in recent months, the current situation remains far better than last winter. On Feb. 2, 2021, the seven-day average of deaths was 211.
Still pushing shots
The refrain remains consistent: Vaccinations and booster shots continue to provide the best protection against the coronavirus. The state of California’s COVID-19 tracking page showed that from Jan.10-16, unvaccinated individuals were 7.5 times more likely than vaccinated people to contract the virus, and 14.9 times more likely to be hospitalized.
Through Jan. 27 (the latest day for which data is available), nearly 81.3% of Los Angeles County residents 5 and up, or about 7.91 million people, had received at least one dose of the vaccine. Approximately 73% of residents are fully vaccinated and 3.24 million have been boosted.
Over the past week, 341,519 shots went into arms, up from the 325,360 jabs administered the previous week. More than 62,000 of the shots given in the past seven days were second doses. Altogether, 17,315,273 shots have been administered in L.A. County.
One curiosity throughout the pandemic has been that women have consistently had a higher vaccination rate than men in Los Angeles County. That trend continues, as through Jan. 27, approximately 83.3% of females 5 and up have received at least one dose. That compares with 79% of eligible males who have gotten at least one shot.
How we did it: We analyzed coronavirus data related to new cases, deaths, hospitalizations and vaccinations provided by the Los Angeles County Department of Public Health, as well as data from the Los Angeles Unified School District.
Interested in our data? Check out the Crosstown coronavirus interactive map or email askus@xtown.la.


