

Despite slight drop in activity, graffiti clean-up crews remain busy


Los Angeles residents are used to seeing graffiti scrawled on garages, walls and other places. Yet there is an indicator that the situation is improving: Toward the end of 2021, the office responsible for eradicating tags was less busy than it had been in years.
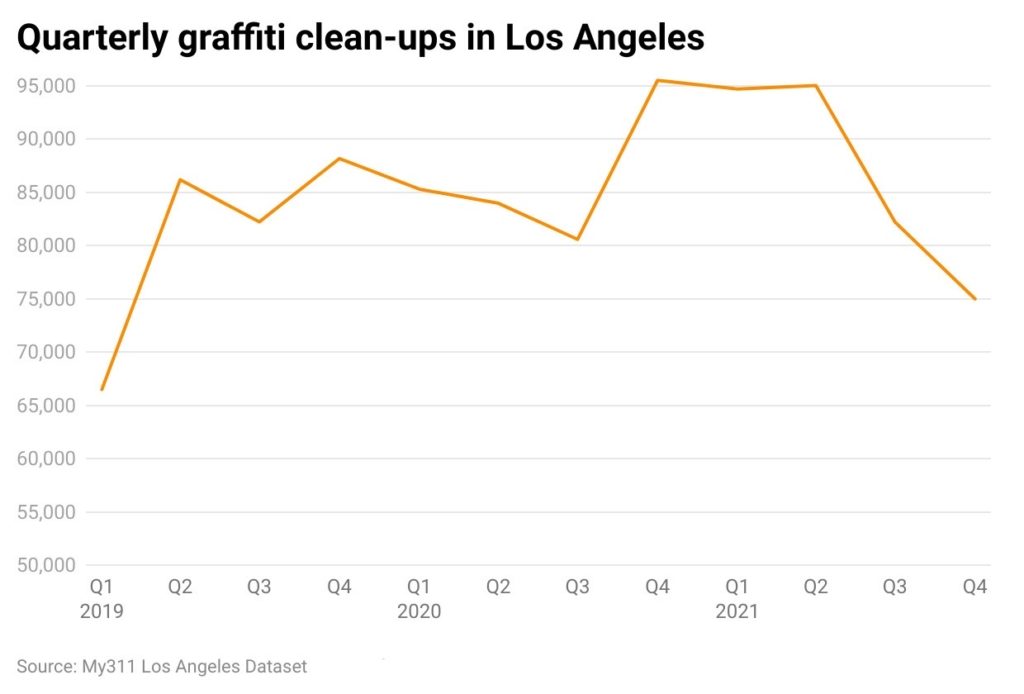
Throughout 2021, there were 346,973 graffiti clean-ups, according to publicly available MyLA311 data (the figure accounts for both complaints lodged by residents and graffiti proactively cleaned up by crews working with the city).
Although that is barely changed from the total in 2020, there were only 75,000 clean-ups in the fourth quarter of last year. That was an 8.8% decline from the previous quarter. It was also a 21.5% drop from the same quarter a year earlier.
Paul Racs, director of the city Office of Community Beautification, said the abatement teams received 125,613 graffiti removal requests last year, an 8.3% decrease from 2020.
“The requests are only about 30% of the work that we do. Most work is proactively done without a request being submitted,” Racs said. “Last year, we removed 35 million square feet” of graffiti.
Racs said one challenge clean-up crews face is that people who tag a wall often return after it has been painted over.
“We sometimes clean up the same wall every single day,” Racs said.
Community impact
As with crimes and service requests, graffiti clean-up is not uniform across the city. Certain neighborhoods historically see disproportionately high levels of tagging, while other communities are touched by spray paint only sporadically.
Crews were most active in Historic South-Central last year. There were 28,703 clean-ups. That was slightly higher than the 26,083 in 2020.
The increase was more pronounced in Boyle Heights. The 21,762 clean-ups was 20.9% higher than the previous year.
Brenda Martinez, a board member with the Boyle Heights Neighborhood Council, said the activity is a combination of gang tagging as well as street artists. The latter are often unaware of legal steps that must be satisfied before painting, including securing permits.
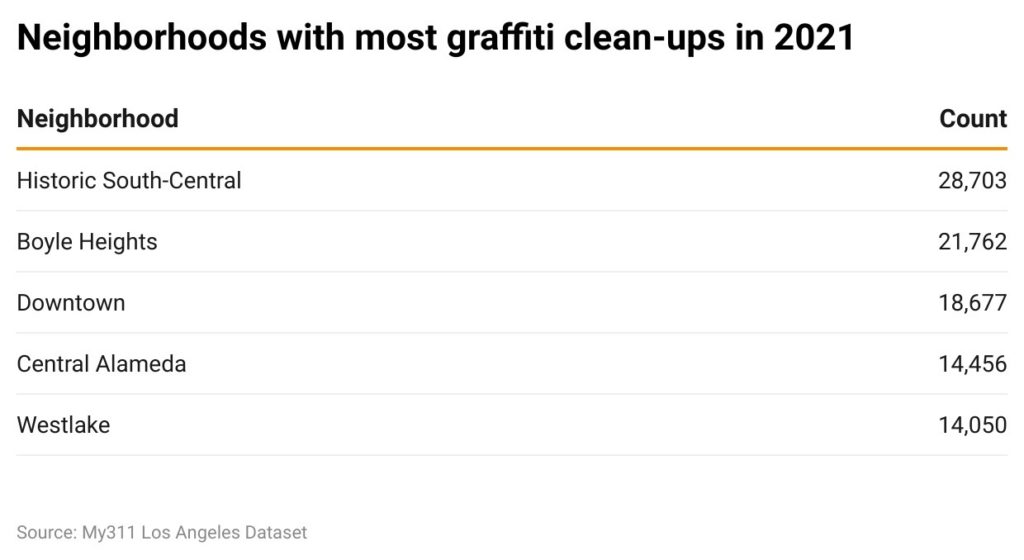
Another active area for abatement crews is Downtown, where there were 18,677 clean-ups in 2021. Claudia Oliveira, president of the Downtown Los Angeles Neighborhood Council, said graffiti on historic buildings can harm the community and its small businesses. She helped form a DTLA Cleaning Initiative, which involves 120 people who proactively eradicate graffiti.
“In Downtown, some of the buildings are over 100 years old,” Oliveira said. “When a person comes and uses either acid or paints, the buildings don’t respond well to that.”
Valley activity
Many Angelenos are familiar with tags in which gang members scrawl their names. Mike Browning, president of the Van Nuys Neighborhood Council, said a fluctuation in graffiti frequency is often related to gang activity. Van Nuys last year had 8,241 requests, a 13.9% decrease from the previous year.
“Van Nuys has a gang problem. Whenever we see an increase of graffiti, we know that there’s more gang activity,” Browning said.
The tagging can detract from the sanctioned efforts to create street art. Hector “Shandu One” Calderon, who has been working in graffiti arts for more than three decades, nodded to the hurdles which must be cleared. He said painting graffiti on a property without an owner’s consent is actually vandalism, not graffiti, and should be taken down.
Having to take down graffiti is not much of an issue in some communities. That includes Beverlywood. According to MyLA311 data, there were only 98 calls to clean up graffiti there last year. Other neighborhoods that didn’t see many abatement crews in 2021 include Playa Vista (139 clean-ups), Porter Ranch (212) and Brentwood (279)
How we did it: We examined publicly available MyLA311 data from Jan. 1, 2019-Dec. 31, 2021. For neighborhood boundaries, we rely on the borders defined by the Los Angeles Times. Learn more about our data here.
Want to know how your neighborhood fares? Or simply just interested in our data? Email us at askus@xtown.la.


