

The Crosstown COVID Tracker


![]()
Los Angeles, like the rest of the world, has spent nearly two years combatting the COVID-19 pandemic. Now a milestone appears at hand: According to Los Angeles County Director of Public Health Dr. Barbara Ferrer, falling coronavirus metrics mean the indoor mask mandate can be lifted in the county beginning Friday.
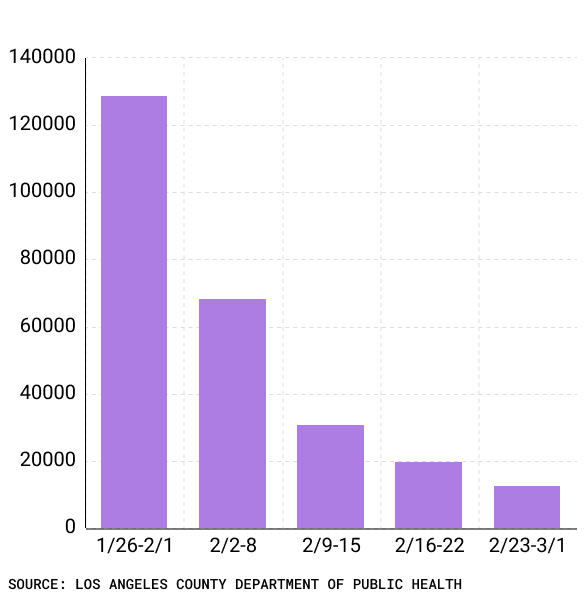
This comes as the county has averaged nearly 1,800 daily new cases over the past seven days. One week before, the seven-day average was 2,587. At the peak of the Omicron surge in mid-January, the county was averaging more than 35,000 cases per day.
Weekly COVID-19 cases in Los Angeles County, Jan. 26-March 1
Additionally, the Department of Public Health, following a move from Gov. Gavin Newsom, announced that beginning March 12, indoor masking in schools will no longer be required, though it remains recommended. That does not mean masks are automatically coming off, as individual school districts make the determination of what happens on their campuses. The Los Angeles Unified School District, which works closely with its teachers union, appears likely to continue with an indoor mask mandate, at least in the short term
The Crosstown COVID Tracker helps you stay up to date on the latest and most important data on infections, inoculations and general risk. Information on cases in individual communities is available on the Crosstown coronavirus interactive map.
More positive indicators
The decreasing number of new daily cases is just one of the indicators allowing people to return to something verging on normal. Another is positivity, and on Monday, the daily test rate fell to 1.1%, the lowest level since Dec. 12. It was 1.2% on Wednesday.
The LAUSD is also seeing a continued decline on this front. From Feb. 22-28, the district reported 1,638 positive results out of 370,744 tests administered to students and staff. That is a positivity rate of 0.44%, down from 0.64% the week prior.
Active outbreaks at K-12 schools fell to 38, down from 46 one week before, according to the Department of Public Health.
[Get COVID-19, crime and other stats about where you live with the Crosstown Neighborhood Newsletter]
COVID-19 hospitalizations also continue to tumble. The level dipped below 1,000 on Monday, the first time in three digits since late December. On Wednesday, 907 county residents were being treated in area hospitals.
The winter peak occurred on Jan. 20, when 4,814 county residents were hospitalized.
COVID-19 hospitalizations in Los Angeles County

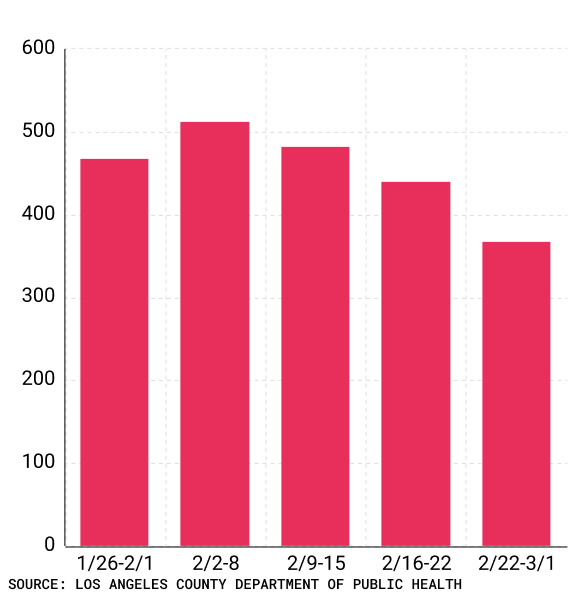
Deaths are ticking down, though they remain above where they were before the Omicron surge. The most recent seven-day average of deaths was 59, and on Wednesday there were 80 reported fatalities. One month ago the average was 68.
Weekly COVID-19 deaths in Los Angeles County, Jan. 26-March 1
Still pushing shots
The evidence of the effectiveness of vaccines continues. According to the state of California’s COVID-19 tracking page, from Jan. 31-Feb. 6, unvaccinated state residents were 5.4 times more likely to contract COVID-19 than those who had received a booster shot.
Through Feb. 24, 82.5% of county residents 5 and up had received at least one dose. Yet boosters continue to lag, and only about 3.57 million people have chosen to receive the additional shot.
From Feb. 18-24, 160,938 shots went into arms in Los Angeles County, up from 51,029 the week prior. Approximately 40,300 of the shots given over the past week were second doses.
With more than 8 million county residents having received at least one dose, vaccine activity is slow compared to this time last year, when people were racing to get inoculated. On Feb. 24, 1,200 shots went into arms. On the same date in 2021, 29,698 doses were administered.
Altogether, 17,868,588 shots have been administered in Los Angeles County.
How we did it: We analyzed coronavirus data related to new cases, deaths, hospitalizations and vaccinations provided by the Los Angeles County Department of Public Health, as well as data from the Los Angeles Unified School District.
Interested in our data? Check out the Crosstown coronavirus interactive map or email askus@xtown.la.


