

The Crosstown Crime Book: August


![]()
Recent high-profile shootings, and reports about a burglary in which guns were stolen from the home of mayoral candidate and U.S. Rep Karen Bass, have drawn heightened attention to public safety in Los Angeles. But truly understanding the crime picture requires looking at current statistics and putting them in context.
That’s where the Crosstown Crime Book comes in. We examine the monthly figures in key crime categories and compare them with recent months, as well as the same month in the past five years. This includes the period before the COVID-19 pandemic, and helps determine whether crime is indeed getting “better” or “worse.”
Here is what Los Angeles looked like in August.
[Get COVID-19, crime and other stats about where you live with the Crosstown Neighborhood Newsletter]
More murders, fewer gunshots
Since the Los Angeles Police Department began making its data publicly available in 2010, there have been only three months in which the city recorded more than 40 homicides. That includes August, when there were 43 murders, the same number as in July (the highest monthly total since 2010 was the 48 in July 2021).
The count also represents a more than 50% jump from May, when there were 28 killings.
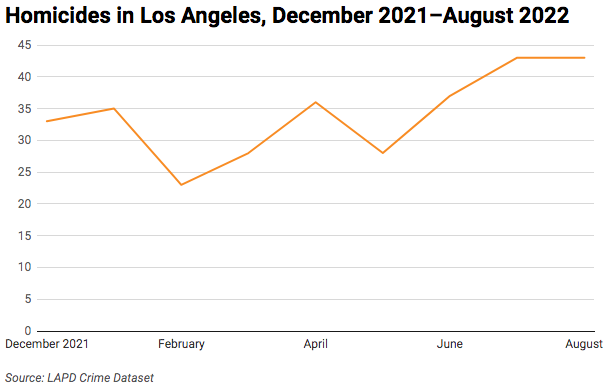
Seven people were killed in Downtown in August. There were four murders each in Florence and Westlake.
Police Chief Michel Moore referenced the situation during the Aug. 30 meeting of the Los Angeles Police Commission, telling the panel, “The month of August has been a mixed bag, where we have seen an increase in homicides compared with the same month last year.”
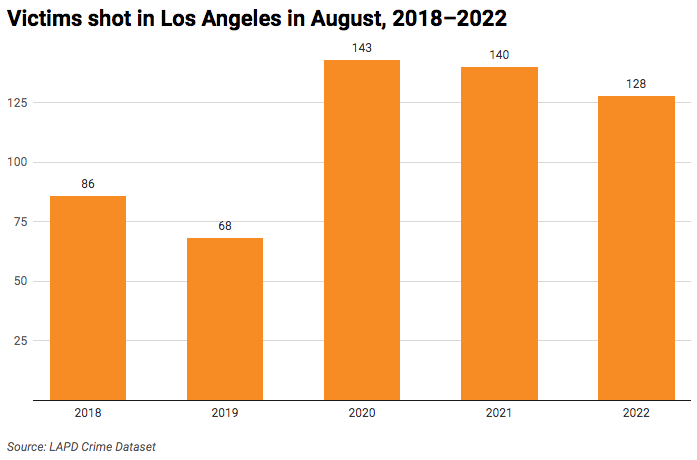
Yet as Moore pointed out, although the number of people killed grew, fewer Angelenos were shot. There were 128 victims struck by gunfire in the city last month. That is below the 139 recorded in June, and also down from the 140 in the same month in 2020.
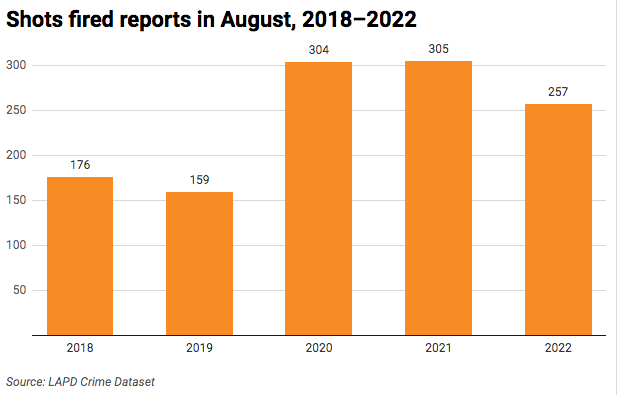
Similarly, shots-fired reports have dropped slightly. The LAPD fielded 257 gunshot reports in August. That is down from 284 in July, and is the second-lowest monthly total this year, above only the 242 in February.
Additionally, the August shots-fired total represents a 15.7% decrease from the 305 reports in the same month in 2021.
Car trouble
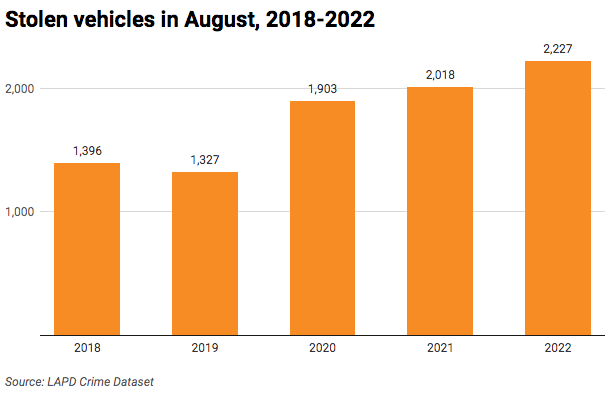
The epidemic of stolen vehicles in Los Angeles continues. August brought 2,217 car-theft reports, making it the seventh month this year that more than 2,000 rides went missing in the city. In the entire 2010s, there was never even a single month with more than 1,800 car thefts.
The August figure is a 59.2% increase over the same month in 2018.
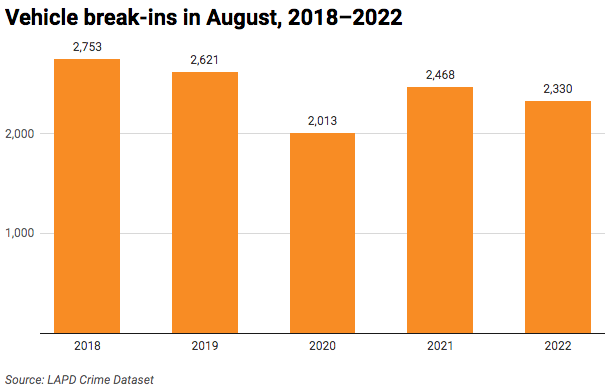
The number of car break-ins declined slightly last month, though it remains the most common crime in Los Angeles. There were 2,330 reports of burglary or theft from a vehicle (BTFV) in August. In the same month in 2018, the LAPD registered 2,753 reports.
As is traditionally the case, dense and heavily trafficked Downtown experienced far more break-ins than any other Los Angeles neighborhood. There were 360 BTFV reports in Downtown in August. The next most-impacted communities were Hollywood (73 reports) and Koreatown (58).
The LAPD classifies stolen vehicles and BTFVs as property crimes. According to department Compstat data, from Jan. 1–Sept. 10 there were 68,307 property crimes in the city. That is a 12.3% increase over the same period last year.
Burglary is also designated as a property crime. There were 1,156 burglary reports in August; that is a 10.1% drop from July, though the number is in line with monthly figures from both 2021 and the pre-pandemic year of 2019.
How we did it: We examined publicly available crime data from the Los Angeles Police Department from Dec. 1, 2021–Aug. 31, 2022, and the periods of Aug. 1–31 from 2018–2022. We also examined LAPD Compstat data. Learn more about our data here.
LAPD data only reflects crimes that are reported to the department, not how many crimes actually occurred. In making our calculations, we rely on the data the LAPD makes publicly available. LAPD may update past crime reports with new information, or recategorize past reports. Those revised reports do not always automatically become part of the public database.
Have questions about our data or want to know more? Write to us at askus@xtown.la.


