

The Crosstown Crime Book: September


As the Nov. 8 mayoral election approaches, crime remains a pressing topic for Angelenos. Developer Rick Caruso and U.S. Rep. Karen Bass have each focused on the need to make the city safer, though they have different visions for the size of the Los Angeles Police Department: Caruso wants to add 1,800 officers to the force of about 9,200 sworn personnel. Bass hopes to bring the department to a pre-pandemic level of near 9,700.
To really determine how many police officers L.A. needs, one should have a full picture of crime, and know whether the present is indeed “better” or “worse” than the past. The Crosstown Crime Book helps provide that context. Using publicly available LAPD data, we look at the monthly figures in key crime categories and compare them with recent months, as well as the same month in previous years.
Here is how the situation looked in September.
Fewer murders
At a meeting this month of the Los Angeles Police Commission, Police Chief Michel Moore announced that through Oct. 1, Part 1 crimes—the category for the most serious offenses—were 9.8% higher than at the same time last year. That, he maintains, is a good thing, as the week before, the increase was 10%. In July, the increase in Part 1 crimes was 11.5%. There have been more criminal incidents than last year, but the year-to-date rise is now trending down.
“We’ve seen reductions both in violent crime,” Moore stated, “as well as in property crime.”
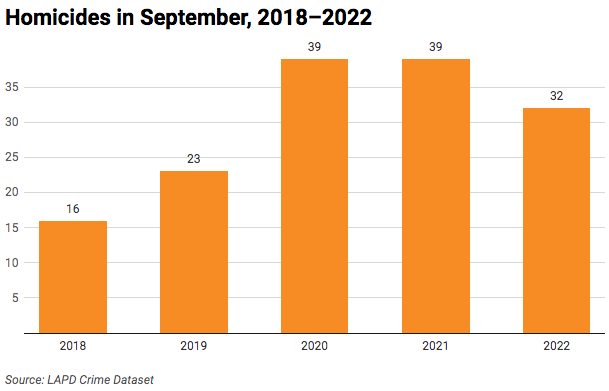
September brought a decrease in homicides. After recording more than 40 murders each in July and August—a monthly total surpassed only one other time since 2010—there were 32 killings in September. That count is also below the figure recorded in each of the last two Septembers.
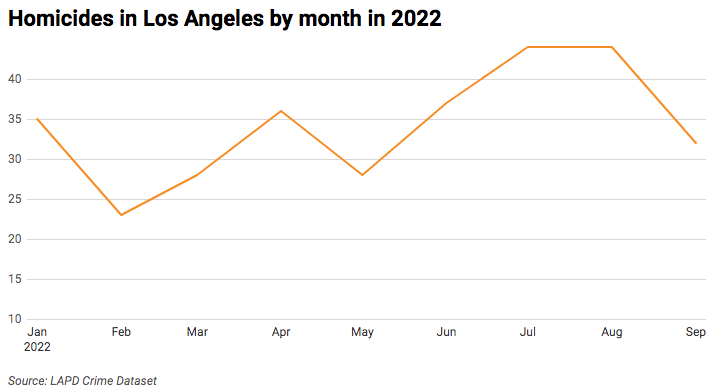
There were five murders last month in the South Los Angeles neighborhood of Florence, and another four in Downtown. From Jan. 1–Oct. 1 the LAPD recorded 304 homicides in the city. Although the figure is unchanged from the same period last year, it is already more than any full year in the 2010s.

Gunshots also down
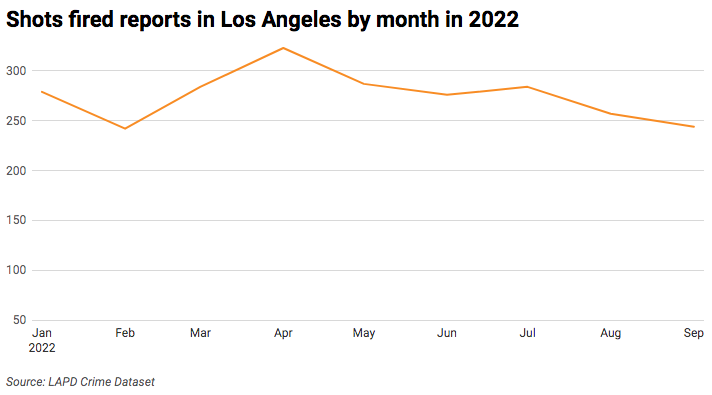
The monthly decline in homicides was accompanied by a dip in both shots fired and victims shot, a critical change given a surge in gun violence that began at the onset of the pandemic (the trend has been seen in many other cities across the country). The 244 shots-fired reports in September was the second-lowest monthly total in 2022.
There were 106 people struck by gunfire in Los Angeles last month. As with homicides, it is below the level in the same month in each of the last two years.
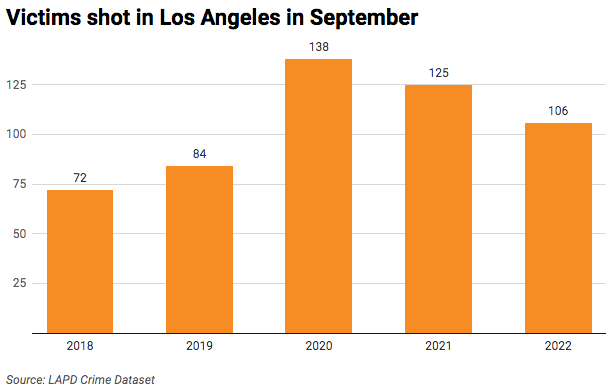
Since the start of the year, there have been 89 gunshot victims in Downtown, more than any other neighborhood in Los Angeles. Another 67 victims were in Boyle Heights.
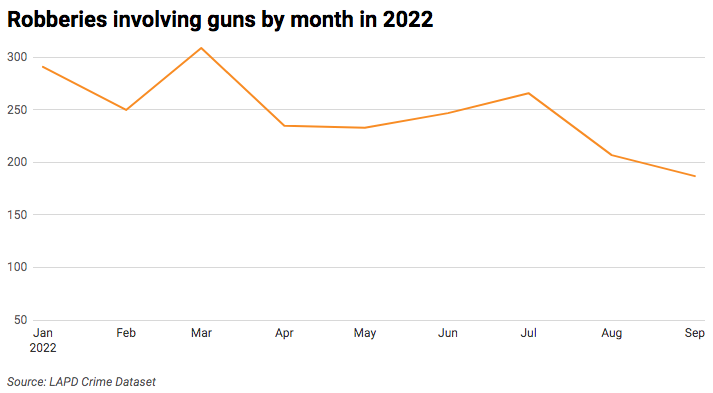
The number of robberies involving guns has also dropped. According to police data, there were 187 such incidents in September, by far the lowest monthly figure this year. The 2022 high occurred in March, when there were 309 robberies involving a firearm.
Things taken
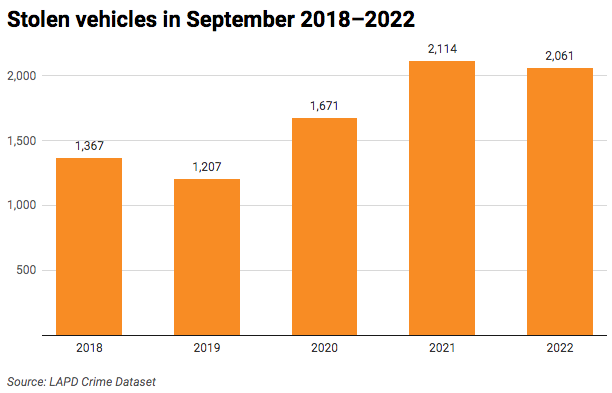
Car thefts in Los Angeles continue at an epidemic level. September was the eighth time in nine months this year with more than 2,000 vehicles stolen. In the 2010s, there were never more than 1,800 such crimes in a single month.
The September total of vehicle thefts is 50% higher than the 1,367 stolen cars in September 2018.
Car break-ins remain the most common crime in Los Angeles, but the 2,172 reports in September was the lowest monthly total in more than a year. The count was 19.7% below this year’s high of 2,706 break-ins, which occurred in March.
September also brought a monthly low for burglaries. There were 1,103 incidents recorded. The 2022 high occurred in May, when 1,343 burglaries were reported to the LAPD.
How we did it: We examined publicly available crime data from the Los Angeles Police Department from Jan. 1, 2010–Sept. 30, 2022. We also examined LAPD Compstat data. Learn more about our data here.
LAPD data only reflects crimes that are reported to the department, not how many crimes actually occurred. In making our calculations, we rely on the data the LAPD makes publicly available. LAPD may update past crime reports with new information, or recategorize past reports. Those revised reports do not always automatically become part of the public database.
Have questions about our data or want to know more? Write to us at askus@xtown.la.


