

Crime at the quarter pole


How do you measure crime beyond raw numbers? Comparisons of particular time periods help, particularly in a city as large as Los Angeles.
In a new feature, Crosstown is seeking to get a sense of safety in the city by examining publicly available Los Angeles Police Department data in the first quarter of 2023. The counts in five key categories will be compared with figures from each quarter during the previous three years, providing a sense of change during and coming out of the pandemic.
[Get housing, crime and other stats about where you live with the Crosstown Neighborhood Newsletter]
We’ll also compare Jan. 1–March 31, 2023 totals with the same period last year, as well as with that timeframe in the pre-COVID year of 2019.
Here, with charts, is what crime in Los Angeles looks like at the quarter pole.
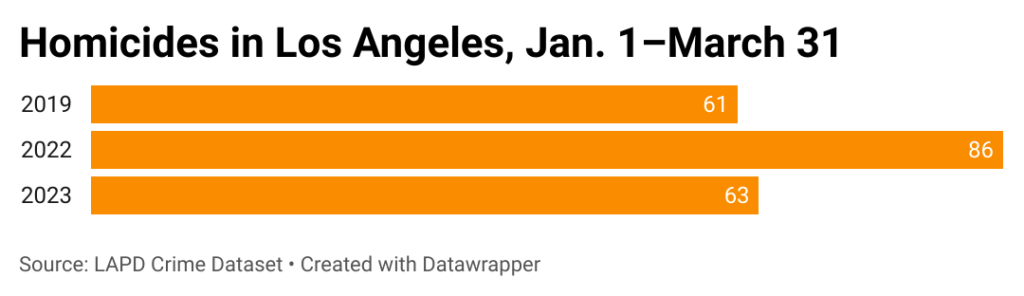
Homicides
Murders have declined after reaching heights not seen in more than a decade. The change is happening quickly. There were 63 homicides in the first quarter of 2023. The count was 121 in the third quarter of last year.
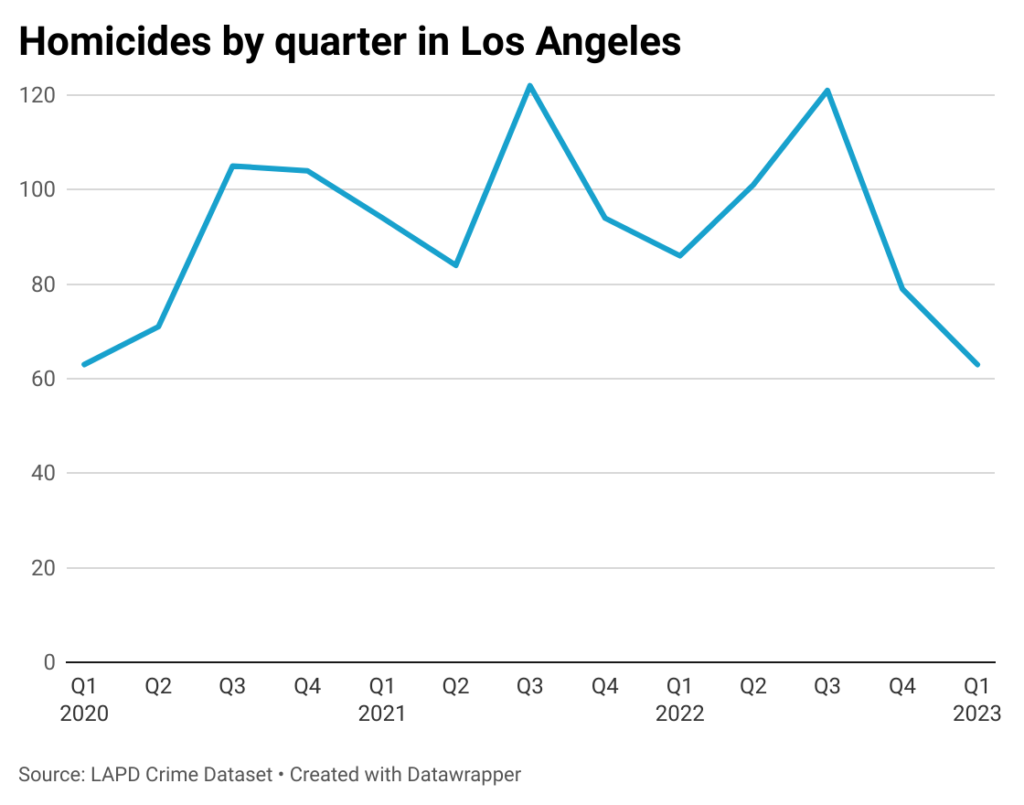
The level is barely above the total in the first three months of 2019. If the pace continues, it would mark a historic decline—that year there were 258 killings in the city. In 2021 there were 402 murders.
The neighborhoods in the city with the most homicides from Jan. 1–March 31, 2023 were: Downtown (11 murders), Westlake (6) and Boyle Heights (4).
Shots Fired
Shots fired often follow an arc similar to that of homicides—this is because in Los Angeles, a firearm is the weapon in about 75% of murders.
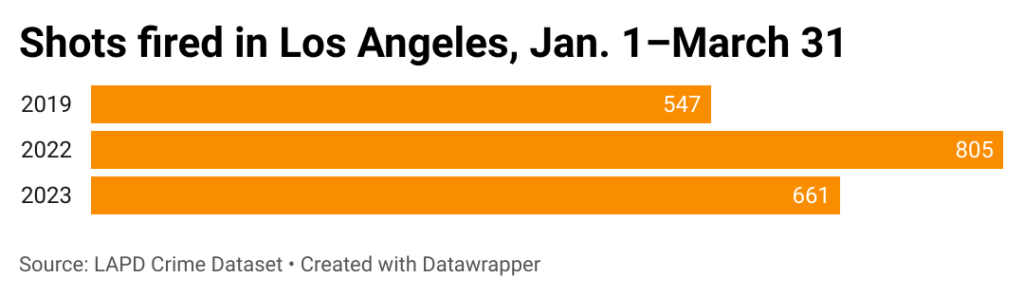
The 661 shots-fired reports in the first three months of 2023 marks the lowest quarterly count in almost three years.
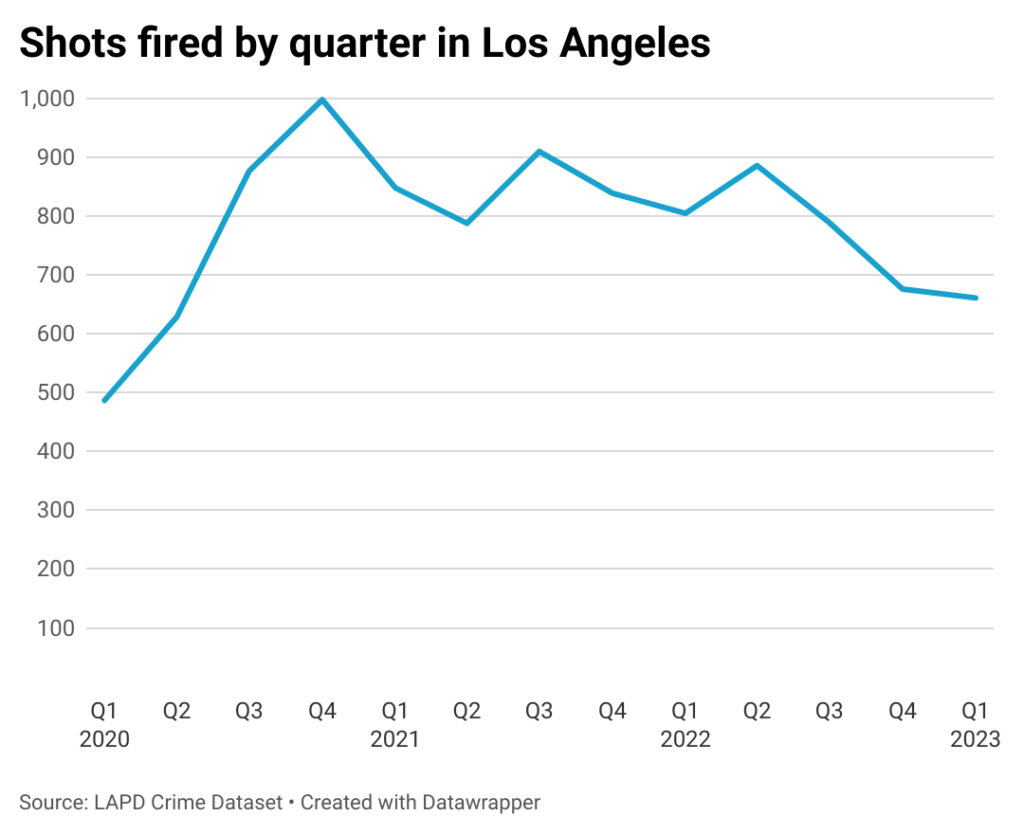
As with homicides, the number of gunshots in the first quarter was far below the same period last year. Yet there was still more gunfire from Jan. 1–March 31 than in the equivalent timeframe in 2019.
There were 48 shots-fired reports in Downtown in the first quarter of this year. Next on the list were Boyle Heights (28 reports), Historic South-Central (27) and Florence (22).
Robberies
Robbery, when someone takes something from another person by threat or force, is considered a violent crime. Overall violent crime in the city through April 1 is down 11.7% compared with the same period last year, according to LAPD Compstat data.
The decline in robberies is even greater—19%. The first quarter total of 1,930 incidents is also significantly below the level in that period in 2019.

Although there was a spike in robberies with guns early in 2022, overall quarterly robbery counts in the last three years have stayed within a relatively narrow range, often between 1,900 and 2,400.
Once again, Downtown saw more robberies in the first quarter than any other neighborhood, with 197. That was followed by Westlake (88), Hollywood (72) and Florence (62).
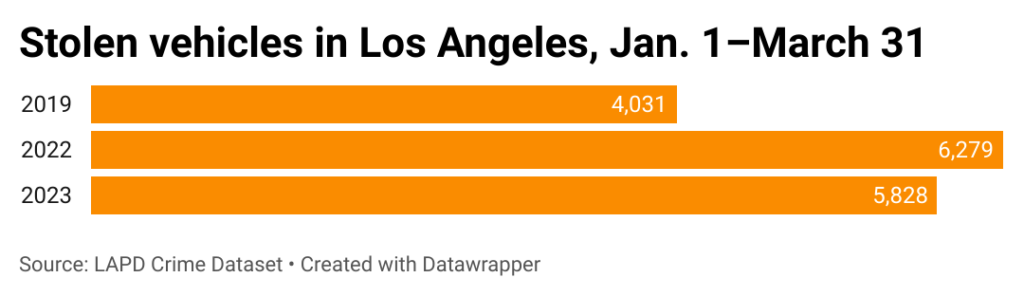
Stolen Vehicles
Car thefts across the nation exploded at the onset of the pandemic, and despite some recent declines, remain far above pre-COVID counts. The 5,828 vehicles stolen in the city of Los Angeles in the first quarter of this year is in line with counts from the early lockdown period.

Fewer vehicles were stolen from Jan. 1–March 31 than in the same period last year. However, this year’s count is 44.6% more than went missing in the first quarter of 2019.
The most impacted neighborhoods this year are Downtown (330 car thefts), Van Nuys (191), Boyle Heights (172) and San Pedro (167).
Burglaries
Burglaries, like car thefts and personal thefts, are classified as a property crime. Through April 1, there were just under 25,000 total property crimes in the city, down 2.3% from last year.
Burglary totals have generally been creeping upwards for nearly two years, after dipping below 3,000 in the second quarter of 2021.
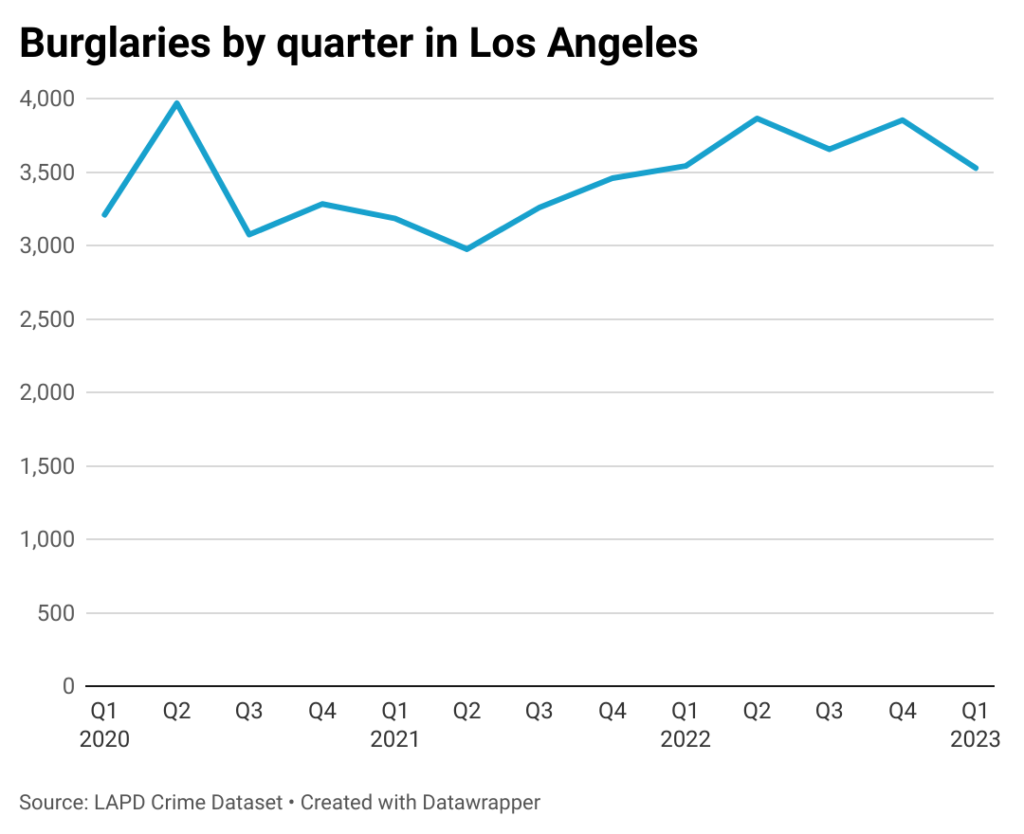
The 3,527 burglary reports in the first three months of 2023 is just 14 fewer than were recorded in the first quarter of 2022. It is also barely changed from the 3,605 in the first quarter of 2019.
The neighborhoods with the most burglaries in the first quarter this year were Downtown (189), Hollywood and Sherman Oaks (both 105), and Koreatown (104).
How we did it: We examined publicly available crime data from the Los Angeles Police Department from Jan. 1, 2019–March 31, 2023. We also examined LAPD Compstat data. Learn more about our data here.
LAPD data only reflects crimes that are reported to the department, not how many crimes actually occurred. In making our calculations, we rely on the data the LAPD makes publicly available. LAPD may update past crime reports with new information, or recategorize past reports. Those revised reports do not always automatically become part of the public database.
Have questions about our data or want to know more? Write to us at askus@xtown.la.


