

The Crosstown Crime Book: July 2023


With the Crime Book, Crosstown examines monthly statistics and trends in criminal activity, using publicly available Los Angeles Police Department data. Here is how things looked in July.
In Los Angeles as in many cities, violent crime typically rises during the summer. The pattern is continuing in 2023, though with some notable changes from the last two years.
[Get crime, housing and other stats about where you live with the Crosstown Neighborhood Newsletter]
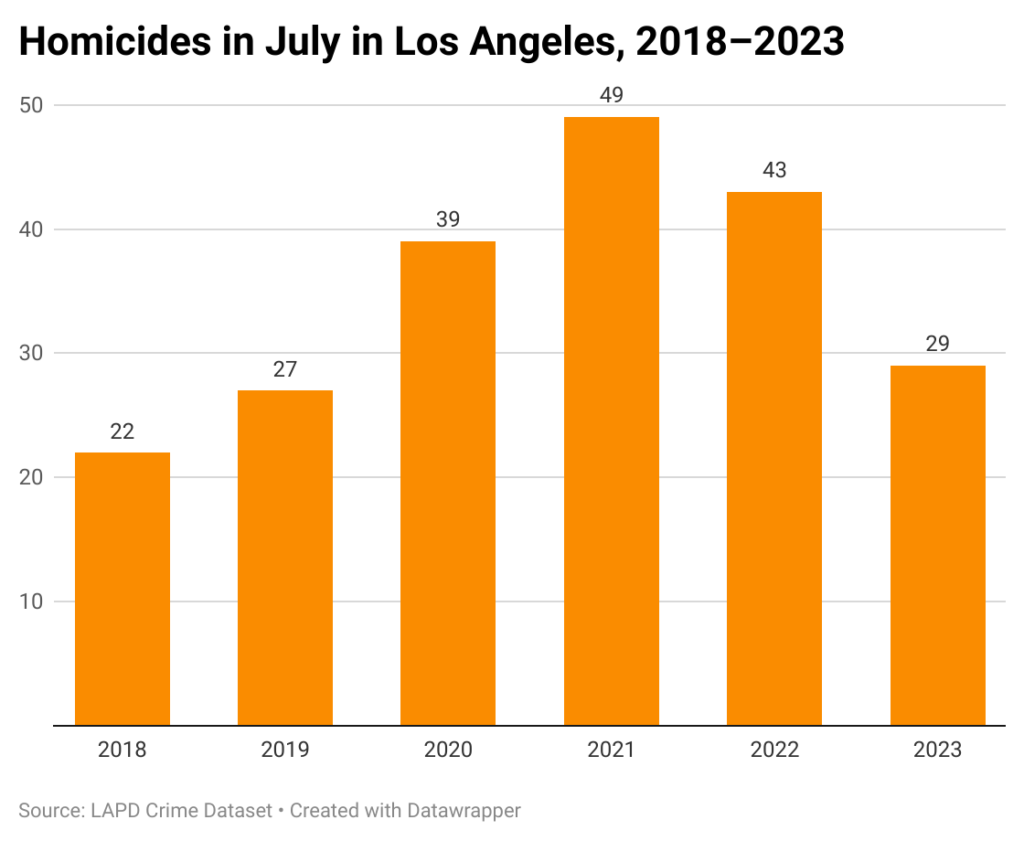
The most significant shift involves homicides, as declines seen in the first half of the year continue. There were 29 murders in July, the lowest total in that month since 2019. It represents a 43% decrease from the 49 killings in July 2021 (that was the deadliest month in the city since at least 2010, according to LAPD data).
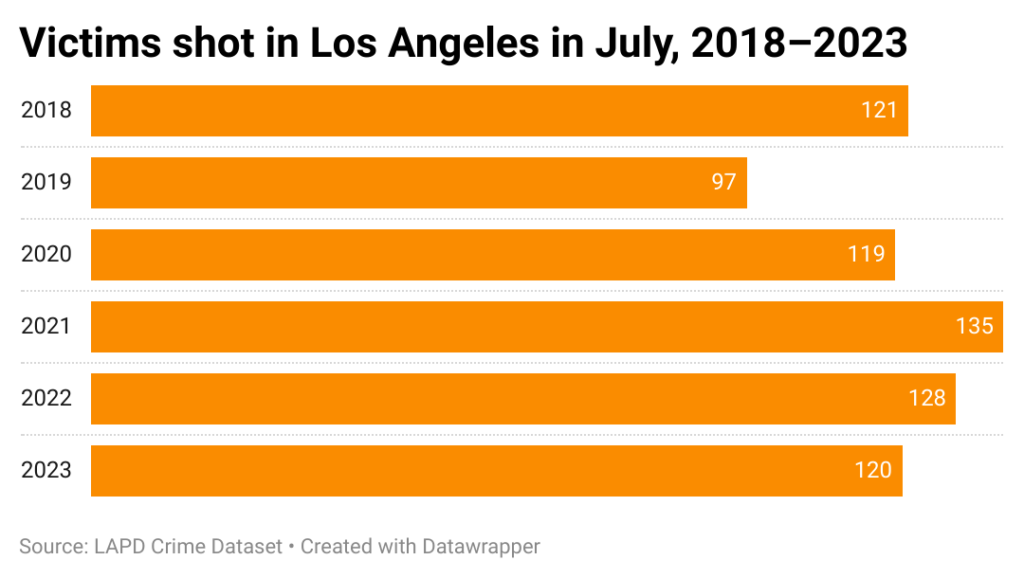
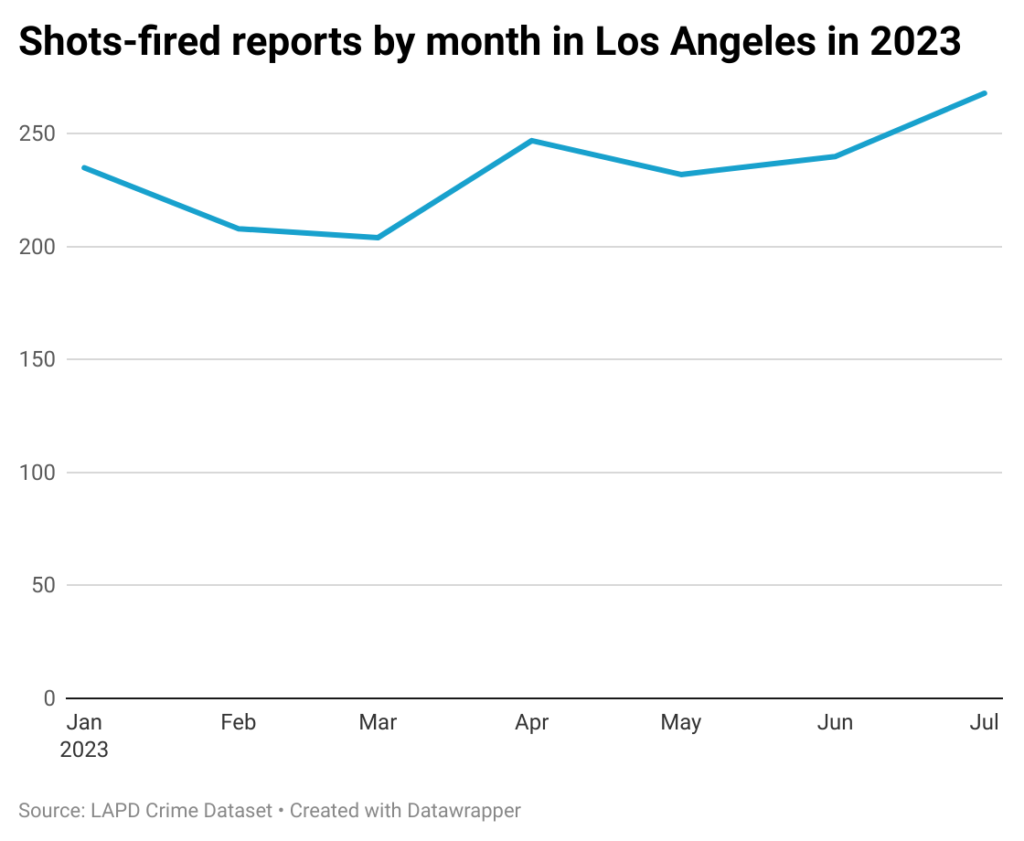
July brought 268 reports of shots fired, and 120 victims shot. As with homicides, both of those are below counts in the same month in each of the last two years.
However, the July figures also represent the highest monthly counts in about a year. The number of shots fired is 31% above the 2023 low, which occurred in March, when there were 204 reports.
No neighborhood suffered more gun violence than Boyle Heights, where there were 26 shots-fired reports in July (resulting in six homicides). The next highest count was the 14 incidents in Westlake.
Overall, the violent crime picture in the city is mixed. There are some declines from pandemic-era peaks, but other data suggests that Los Angeles is more dangerous than before COVID-19.
Police Chief Michel Moore made the point at the July 25 meeting of the Los Angeles Police Commission, when he discussed year-to-date robbery figures compared with the same timeframe four years ago.
“This is probably our most pressing challenge,” Moore stated at the meeting. ”While we have a 14% reduction [in] robberies as a city, we have a more than 16% increase in robberies involving a firearm from 2019.”
There were 249 robberies involving a gun in July, by far the highest total this year.

According to LAPD Compstat data, there were 17,448 violent crimes reported in the city from Jan. 1–Aug. 5 of this year. That is down 8.7% from the same period in 2022.
Stealing from cars and stores
The situation is different when it comes to property crime, which is essentially flat compared with last year.
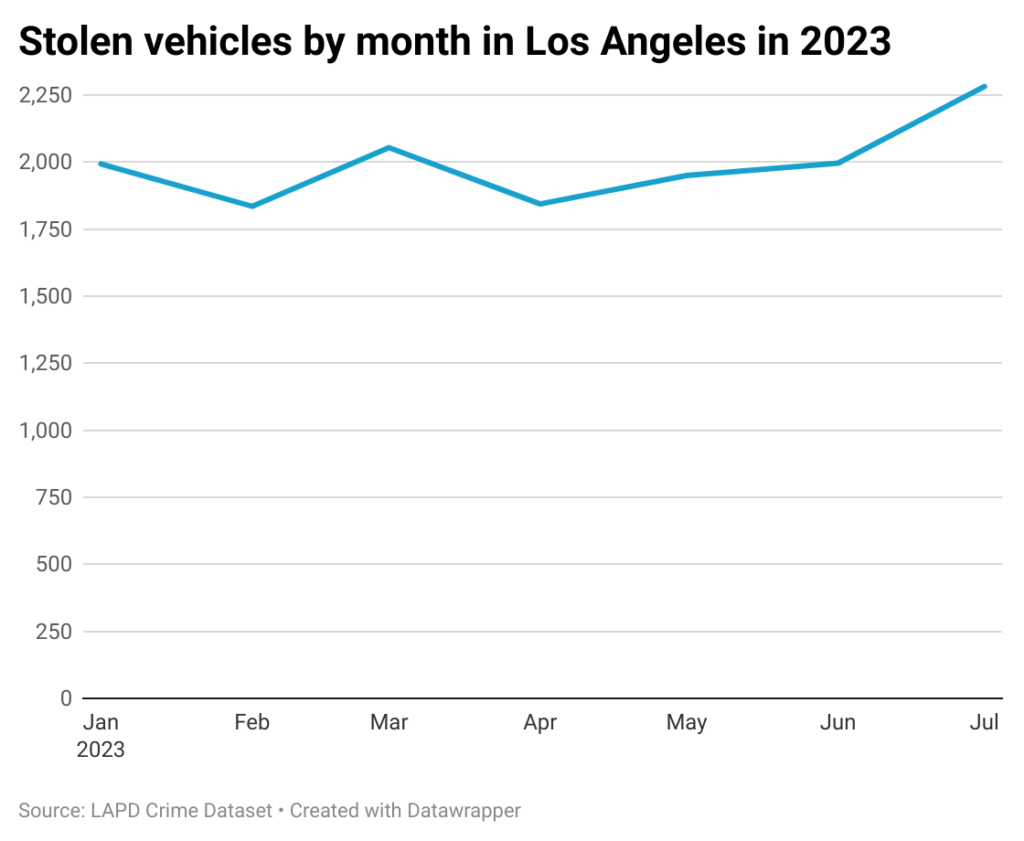
Coming out of the pandemic, there had been a slight downturn in car thefts. That abruptly ended last month, when there were 2,282 reports of vehicles stolen. The last time the monthly count was above 2,200 was August 2022.
Car-centric Downtown recorded 136 stolen vehicles in July, more than any other neighborhood in the city. The second-highest total was the 89 thefts in San Pedro.
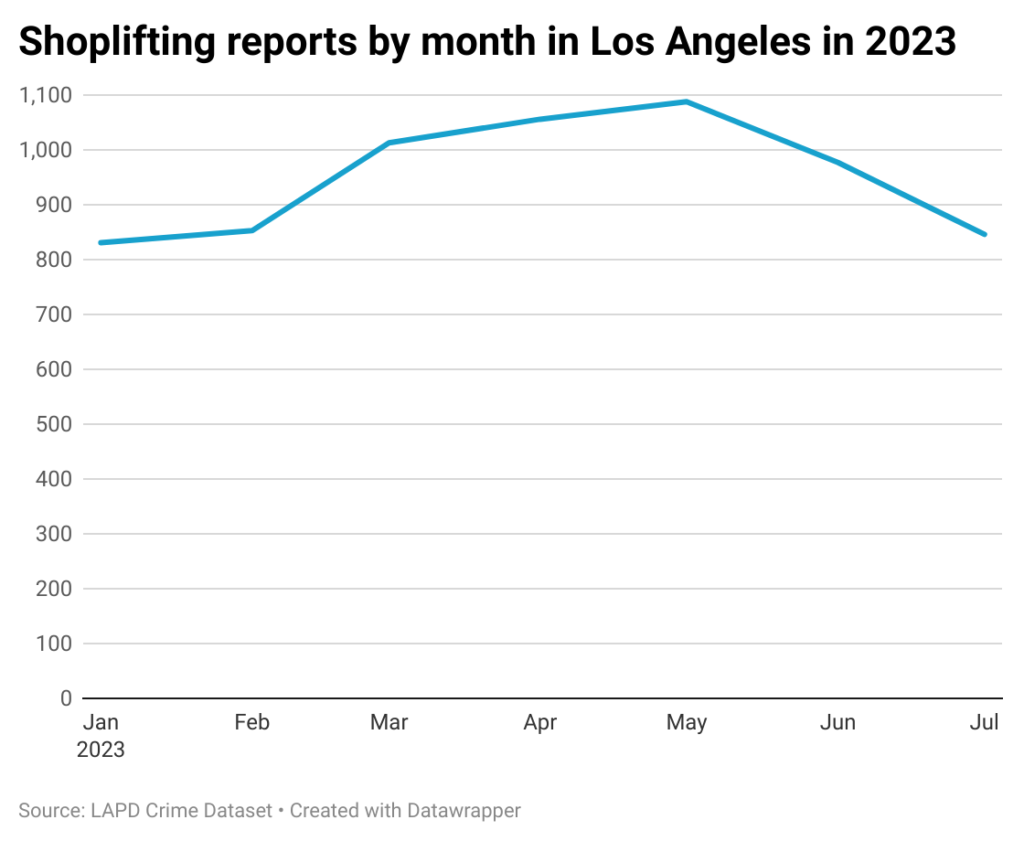
There was a shift in the opposite direction in another crime category: shoplifting. Totals had risen each month this year through May, peaking at 1,088 reports. Counts have since gone down, to 846 in July.
A downward trend also continues in identity theft. Crosstown recently reported that incidents have been declining from a high of 2,243 reports last December. The count has been below 1,000 since April, and in July there were 668 reports, according to LAPD data.
The neighborhoods with the highest identity theft totals in July are in separate parts of the city: There were 18 reports both in Downtown and in the San Fernando Valley community of North Hills.
How we did it: We examined publicly available crime data from the Los Angeles Police Department from July 1, 2018–July 31, 2023. We also examined LAPD Compstat data. Learn more about our data here.
LAPD data only reflects crimes that are reported to the department, not how many crimes actually occurred. In making our calculations, we rely on the data the LAPD makes publicly available. LAPD may update past crime reports with new information, or recategorize past reports. Those revised reports do not always automatically become part of the public database.
Have questions about our data or want to know more? Write to us at askus@xtown.la.


