Winter brings cold COVID cases

Three years ago at this time, Los Angeles entered a grim stretch. As the region experienced the falling temperatures of its first pandemic winter, and people spent more time indoors, where coronavirus transmission is easier, counts began spiking. By mid-December the County Department of Public Health was recording more than 10,000 new COVID-19 cases each day.
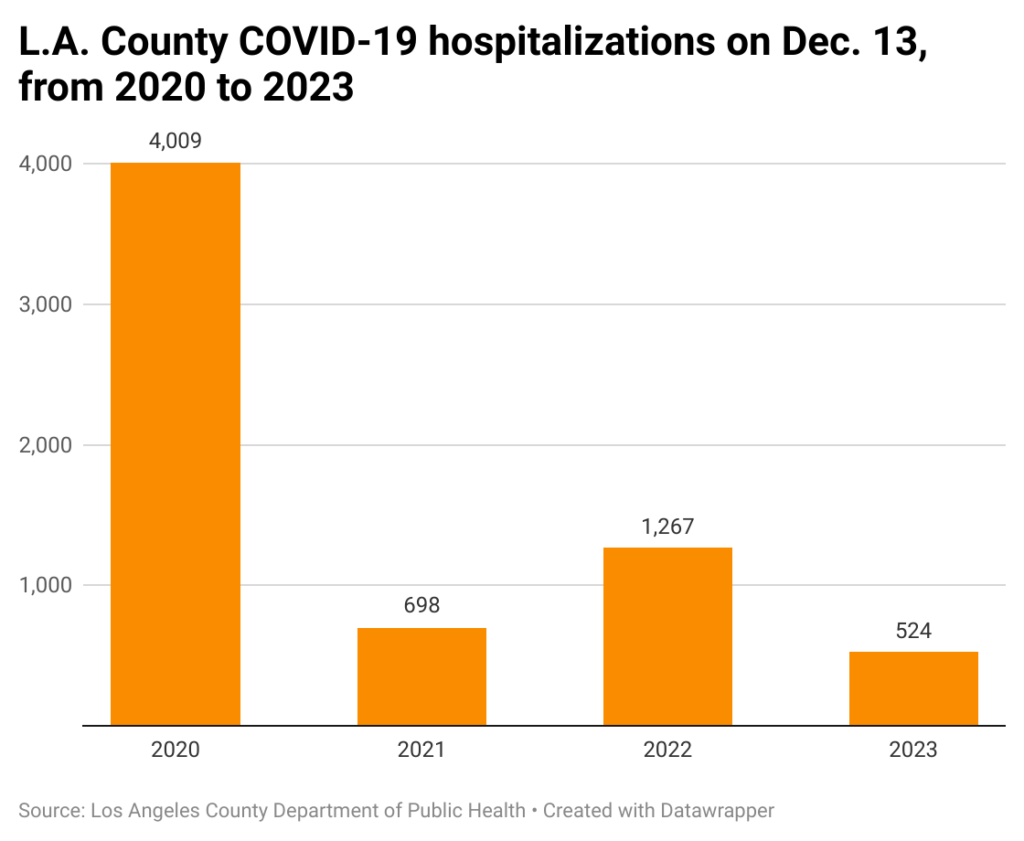
With vaccines still months from being widely available, some people suffered severe consequences. On Dec. 13, 2020, 4,009 people were hospitalized; in January the figure would surpass 8,000.
The death toll also shot up. For a brief stretch in early 2021, there were more than 200 COVID fatalities each day.
[Get crime, housing and other stats about where you live with the Crosstown Neighborhood Newsletter]
By those dire standards, the present-day situation is mild. Yet even if current figures barely compare with our first COVID-19 winter, complications from the coronavirus can put people in the hospital, and even prove fatal.
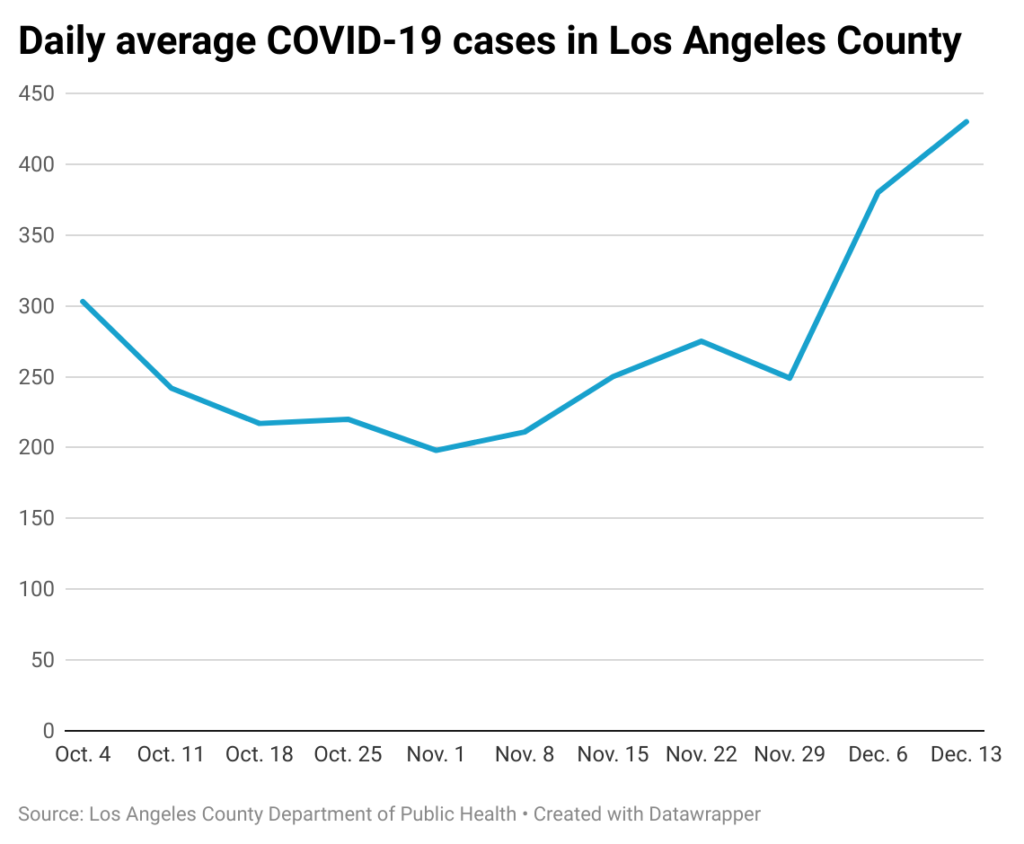
According to the Department of Public Health’s Thursday update, an average of 430 new cases are being diagnosed each day. That is an increase of 50 from last week, and marks a 73% rise from the figure on Nov. 29.

It remains virtually impossible to compare current numbers with those of several years ago, as today most positive results identified in at-home tests are never reported to health authorities.
Medical treatment
Past vaccinations and prior infections have provided many people with a level of immunity. Even if someone contracts the coronavirus, a positive test result is often accompanied by only minor symptoms.
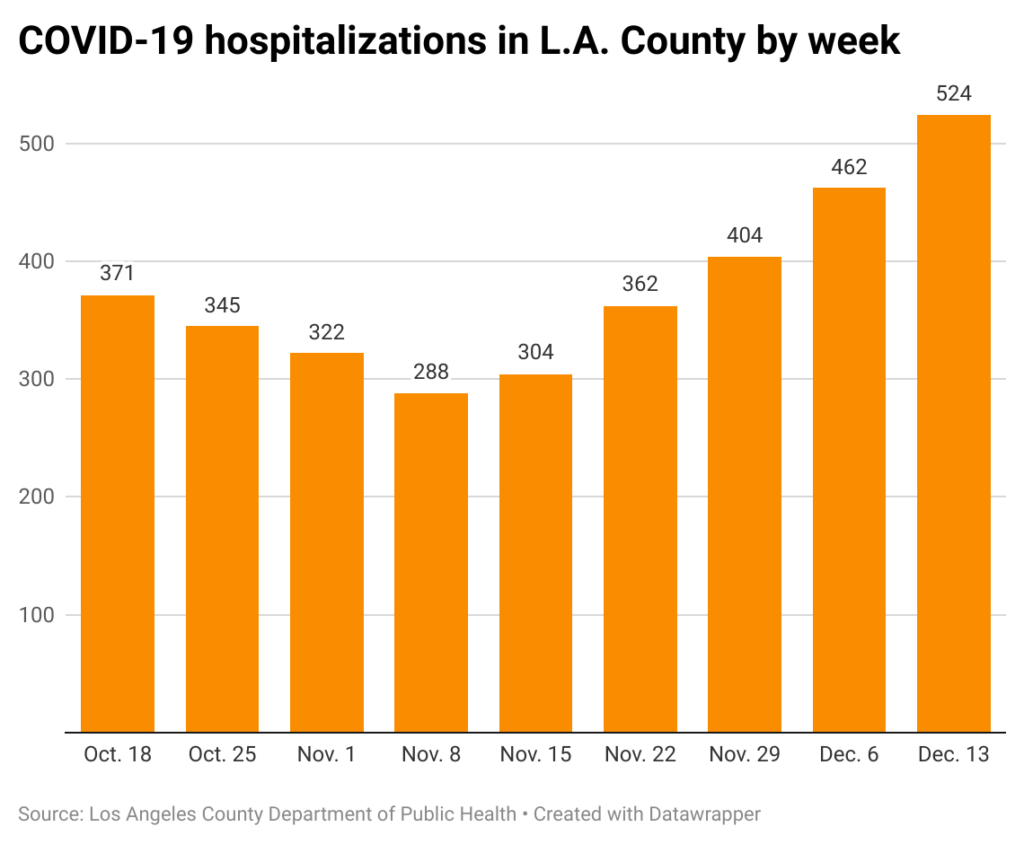
However, the number of people requiring high-level medical care is rising. According to the Department of Public Health, on Dec. 13 there were 524 people with COVID-19 in L.A. County hospitals. That is a 13% increase from last week.

It also marks the fifth consecutive weekly increase, and is the highest number of hospitalizations since late September.
There has been an up-and-down quality to early winter counts. The 524 L.A. County hospitalizations tabulated on Wednesday is closer to the figure on the same date in 2021 than last year.

Other concerns
COVID is not the only concern for health authorities. Winter is expected to bring heightened numbers of flu and respiratory syncytial virus (RSV). The Department of Public Health recently launched a new dashboard to track these and other respiratory illnesses.
The latest COVID vaccine has been approved for people 6 months and up, and the Centers for Disease Control and Prevention has urged everyone who is eligible to get a shot. The outreach is local, too.
“Vaccination is the best defense against severe illness and hospitalization and is especially important for people who are older or have underlying health conditions,” the Department of Public Health stated in a recent briefing.
The department has also pointed to research showing that being vaccinated helps protect against developing Long COVID.
However, relatively few people are taking advantage of the opportunity. According to the department’s vaccine dashboard, more than 8.2 million county residents received at least one dose of the original vaccine. Just 878,000 people, or 9% of the population, have gotten the current shot.
Seniors continue to be the most amenable to being vaccinated. According to the dashboard, 22% of those 65 and up, or approximately 305,000 county residents, are up to date.
Across California, 10.1% of the population has received the new dose, according to the state’s vaccine dashboard. That includes 26.7% of seniors.
According to the state dashboard, just 6.2% of Californians ages 18-49 are up to date.
How we did it: We analyzed coronavirus data through Dec. 13, 2023, related to new cases, deaths, hospitalizations and vaccinations provided by the Los Angeles County Department of Public Health. The data only reflects cases reported to the department, and not how many cases actually occurred. We also examined state of California vaccine data.
Learn more about our data here. Any questions? Email askus@xtown.la.


