

More Angelenos ask for city services in first quarter


In her recent State of the City address, Mayor Karen Bass said that in 2023, Los Angeles fielded an increasing number of service requests. “One hundred thousand more 311 calls were answered” than the year before, she declared.
The trend has continued in the first quarter of 2024. According to publicly available MyLA311 service request data, from Jan. 1–March 31 there were 339,000 calls to the city’s free system. Angelenos asked for help with everything from removing bulky items to clearing roadkill.
The count in the same period in 2023 was 304,000 calls. Yet the figure in that timeframe has been higher, including in the first quarter of 2021. With the pandemic limiting physical interactions, there were 377,000 service requests.

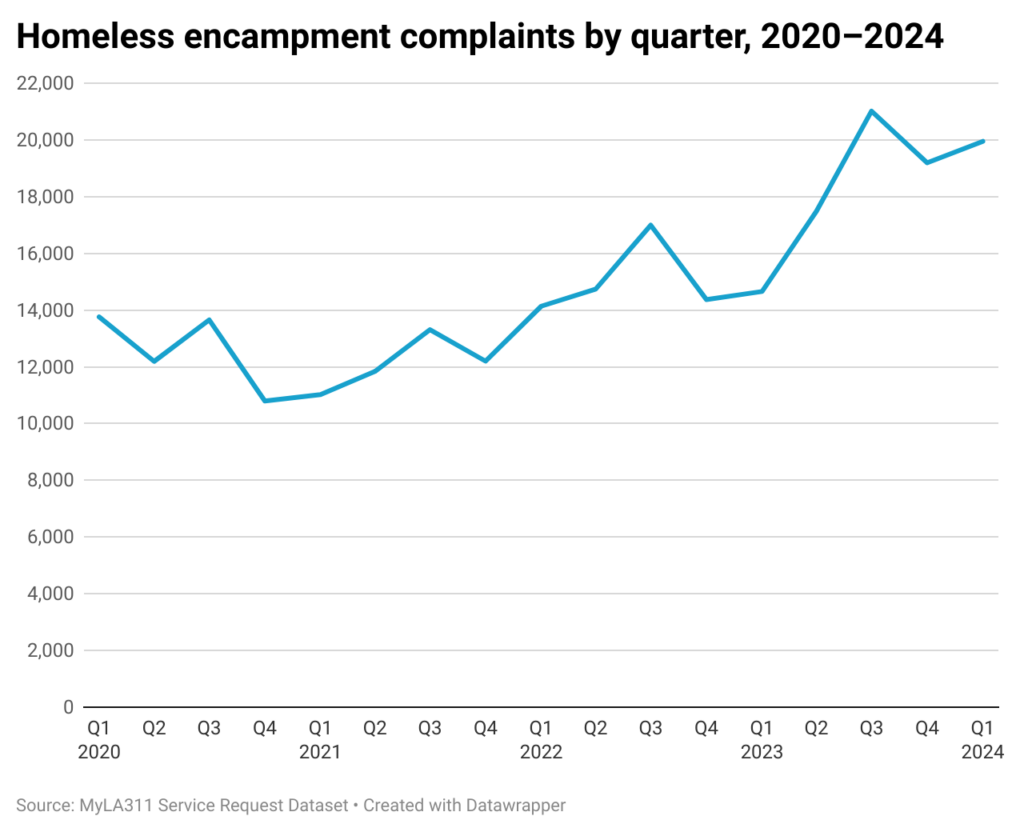
One of the most significant shifts involves complaints about homeless encampments. In the first quarter of 2024 there were 19,950 such calls. That is up 36% from the first quarter of last year.
Multiple factors contribute to the increase. They include the growing number of people experiencing homelessness, with the count hitting more than 46,000 in the city last year. Then there is the attention raised by Inside Safe. The publicity around Bass’ program to move people from large encampments into hotels and motels could spur more people to call 311.
The net result was a dramatic spike in calls in 2023, with the peak being the 21,015 reports in the third quarter.
Westlake registered 1,658 homeless encampment calls in the quarter, more than any other neighborhood. The next highest counts were in Hollywood (933) and Downtown (886).
Change coming
Calls for service come in three ways: by dialing 311; visiting the MyLA311 website; or using a mobile app.
Major changes are underway. Last year Bass issued an executive order to “modernize” MyLA311. According to a statement from her office, plans are “to replace the current aging system with a new, cloud-based solution.” The end result, she promised, will be a more “transparent” program that allows people to track the status of their request.
[Get crime, housing and other stats about where you live with the Crosstown Neighborhood Newsletter]
Raw numbers may also change. The current public data details only about a dozen of the 68 services people can request. Not currently included are figures for reporting potholes, hauling away junked vehicles and more.
The most frequently requested service in the first quarter of 2024 was bulky item pick-up, with 160,000 calls. That is more than twice the total of the second most-sought service, graffiti eradication.

Squeaky wheels, different needs
Service calls come from neighborhoods across Los Angeles. Naturally, some densely inhabited communities generate the most requests.
In the first quarter of the year, Boyle Heights topped the list, with 11,250 reports. The next-highest count was the 9,585 service requests in Van Nuys.
Different neighborhoods have different needs. Still, the dispersal of requests by community can be striking.
Consider, for example, calls from Boyle Heights and Eagle Rock in 2023. Both are on the east side of Los Angeles, in Council District 14.
During the year, 58.4% of the service requests in Boyle Heights were for graffiti removal. Next was bulky item pick-up, accounting for 23.2% of calls.

In Eagle Rock, 62.7% of requests were for bulky item pick-up, while just 6.9% were graffiti eradication. The second-most requested service in the neighborhood was the removal of metal or household appliances—it represented 13.4% of calls.

In Boyle Heights, 3.7% of calls were for hauling away metal appliances.
How we did it: We examined publicly available MyLA311 service data from Jan. 1, 2016–March 31, 2024. For neighborhood boundaries, we rely on the borders defined by the Los Angeles Times. Learn more about our data here.
The city of Los Angeles may update past service requests with new information, or recategorize past reports. Those revised reports do not always automatically become part of the public database.
Have questions about our data or want to know more? Write to us at askus@xtown.la.


