

Los Angeles sees fewer requests to clean graffiti and haul away old couches


On April 17, Mayor Karen Bass delivered her first State of the City speech. In addition to discussing plans to address homelessness and boost the number of Los Angeles Police Department officers, she had a request.
“The city can act faster when Angelenos let us know where problems are in their neighborhoods or along their commutes,” Bass stated during the evening address. “So here’s a plug: For potholes, graffiti or that couch on the curb, please call 311 or download the 311 app.”
[Get crime, housing and other stats about where you live with the Crosstown Neighborhood Newsletter]
Many people are already doing that, with regular requests for service to the 311 system. As Bass said, people can use the phone, the MyLA311 website or an app.
Crosstown has examined publicly available MyLA311 data to determine what kinds of services people asked for in the first quarter of 2023, how that compares to previous quarters both during and before the pandemic, and which neighborhoods request the most help. Here is how it breaks down.
Overall calls
Think of the 311 system as a portal that directs Angelenos to a variety of (non-emergency) help. Things such as bulky item pick-up, calls about homeless encampments and even dead animal removal are all grouped together under the rubric of service calls (the pothole complaints Bass mentioned are tallied elsewhere). The data encompasses requests from citizens, as well as proactive work by city employees or contractors who see and resolve a problem before someone reports it (for example, graffiti abatement crews will paint over any tags they discover, whether or not someone has called).
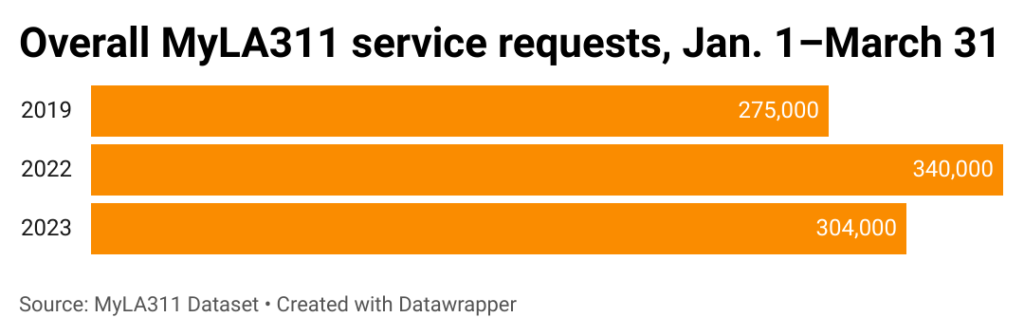
Service calls rose quickly at the onset of the COVID-19 pandemic, and peaked in the third quarter of 2020. Then, as people came out of their homes, requests declined. There were about 304,000 total reports in the first quarter of this year.
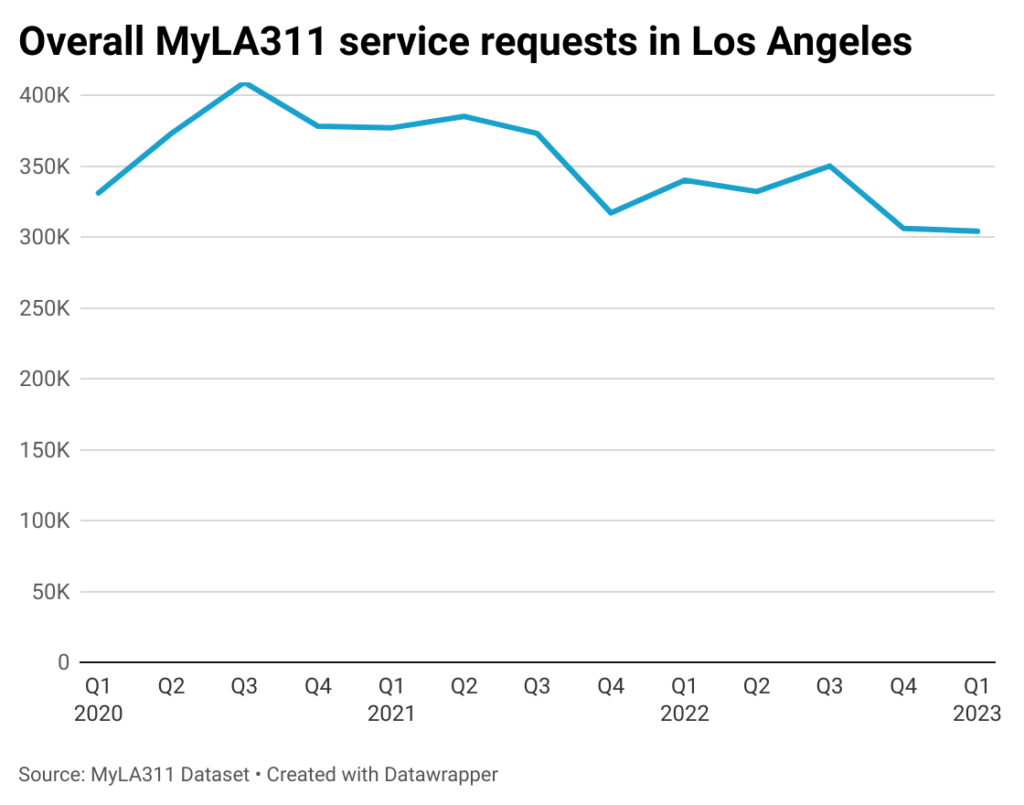
That is about 36,000 fewer calls than were placed in the first quarter of last year, a drop of 10.6%. However, it is approximately 29,000 more requests than were made in the first quarter of 2019, before the pandemic changed everything.
The neighborhoods in the city where residents made the most total requests in the first quarter of this year were Boyle Heights (10,819), Westlake (9,041), North Hollywood (8,391) and Van Nuys (7,636).
Bulky item pick-up
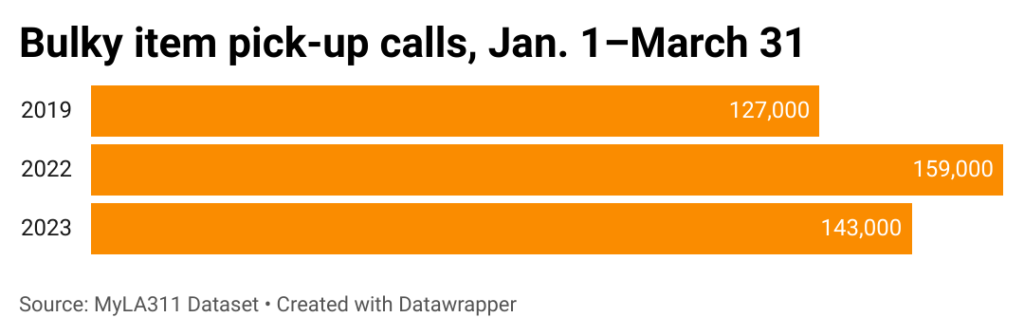
The most common city service request is bulky item pick-up. Haul a mattress or old desk out to the curb, call 311, and sanitation crews will usually remove it on the next regularly scheduled trash day, for no fee (beyond taxes already paid). There were approximately 143,000 such requests in the first quarter, or 47% of all MyLA311 calls.
Bulky item pick-up also shot up in the third quarter of 2020. Requests remained elevated for about a year.
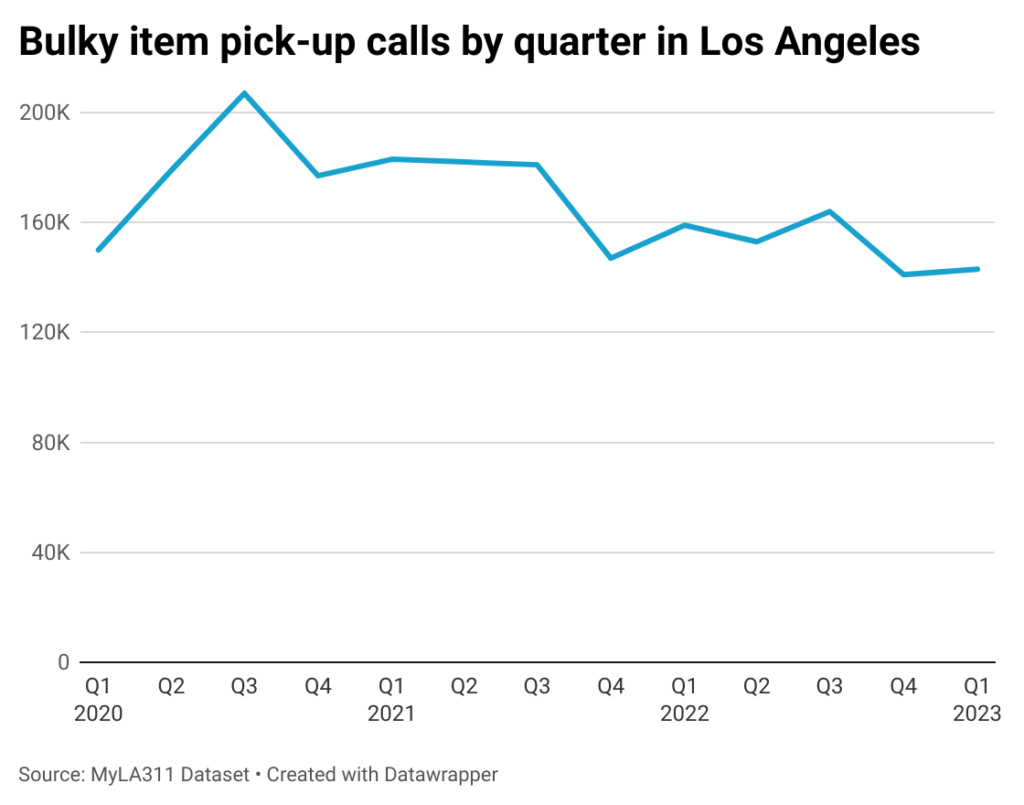
The first quarter count is 10% below the number of requests in the same period last year. It is greater than the number of calls in the first three months of 2019.
Van Nuys ranked fourth in overall MyLA311 calls in the first quarter, but it was the top community for bulky item pick-up, with 3,895 requests. Next on the list were North Hollywood (3,705), San Pedro (3,693) and Sherman Oaks (3,038).
Graffiti removal
The city of Los Angeles has an Office of Community Beautification that, among other efforts, coordinates clean-up after people spray paint walls, garage doors and other property. The crews are constantly busy.
Over an approximately nine-month period starting in late 2020, there was a surge in graffiti abatement in the city, from around 85,000 clean-ups to approximately 95,000 responses each quarter. The number dipped to about 78,000 in the first three months of this year.
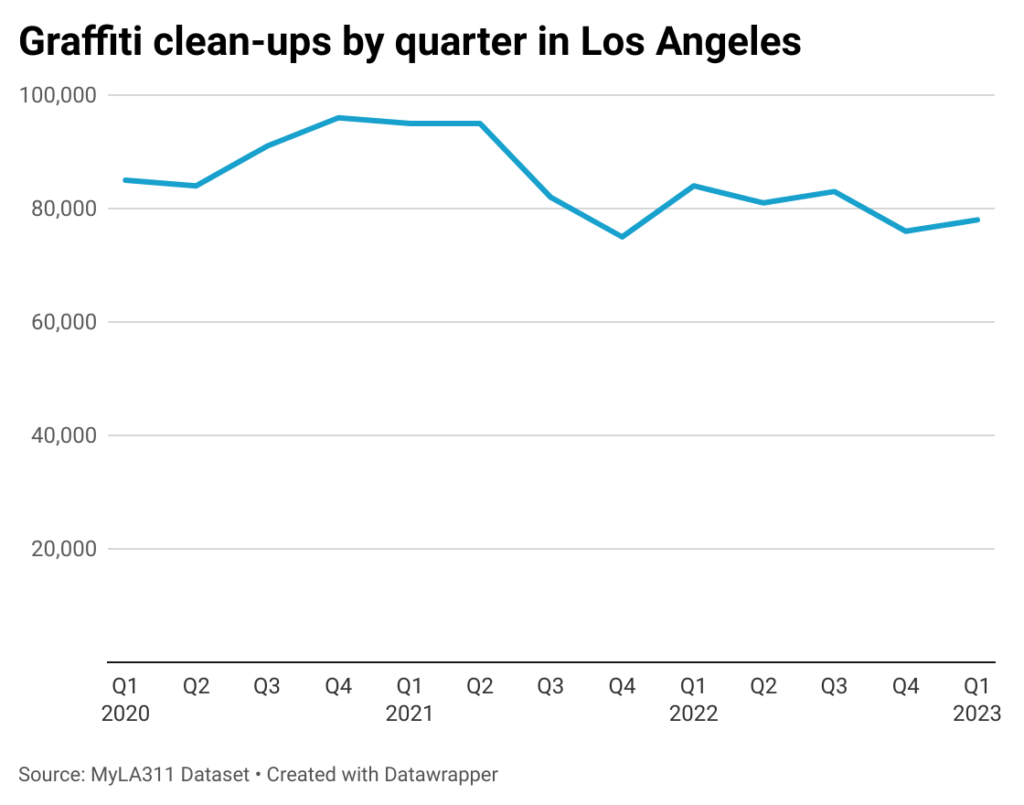
First quarter graffiti clean-up was below the level in the same period last year. But as with overall 311 calls, numbers were higher than in the initial part of 2019.

Where are taggers most active? In the first quarter Boyle Heights registered 6,626 graffiti clean-up responses, followed by Downtown (5,547), Westlake (4,623) and Historic South-Central (4,519).
Illegal dumping
Consider this the “cousin” of bulky item-pickup, though it is more nefarious. Illegal dumping usually involves an individual or business seeking to avoid paying proper disposal fees, and instead tossing their garbage elsewhere. This can be everything from cardboard boxes to construction detritus to hazardous materials. It has long been a problem in the Northeast San Fernando Valley, with people exiting freeways, dumping their trash, then speeding off.
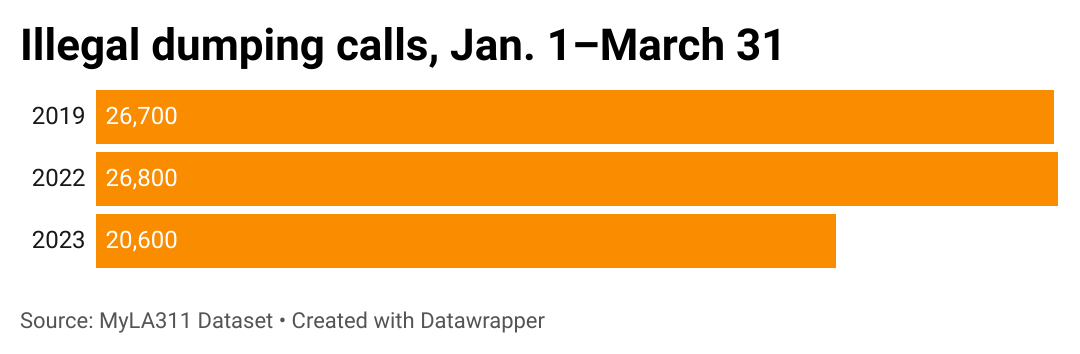
After approximately 32,600 illegal dumping reports in the third quarter of 2021, the practice has been steadily declining. From Jan. 1–March 31 this year, the city tallied about 20,600 calls.
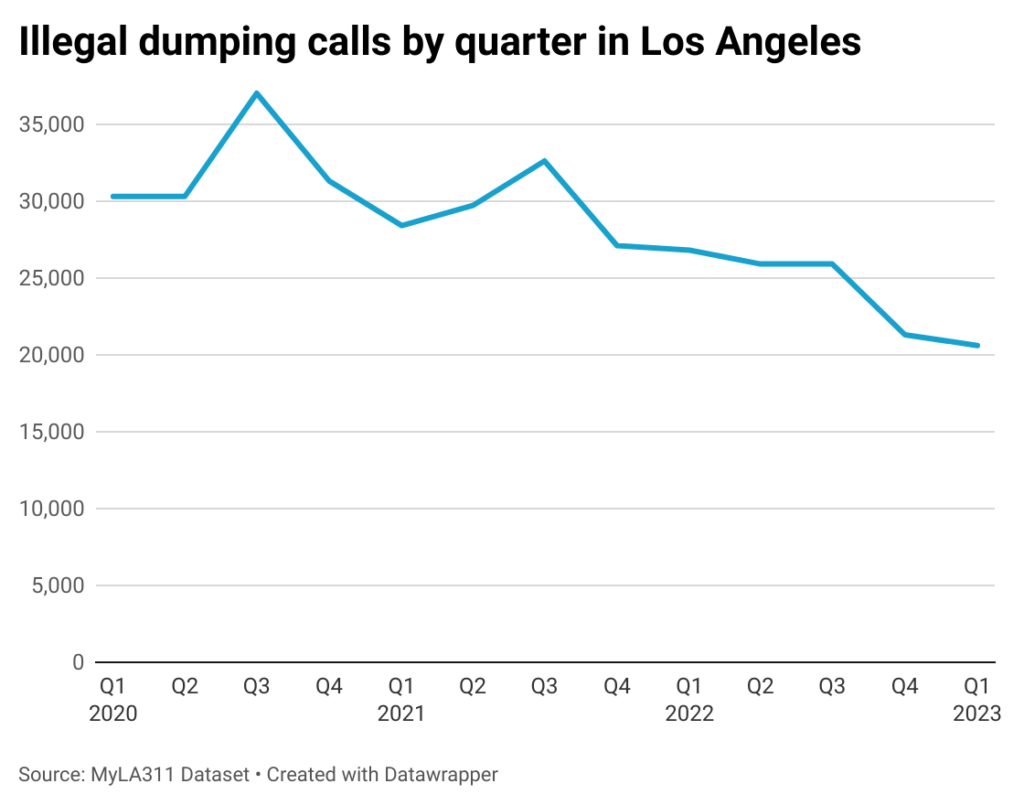
This is below both the number in the first quarter of last year, and the total in the first three months of 2019.
North Hollywood got dumped on 646 times in the first quarter, more than any other neighborhood in the city. Next were Van Nuys (599), Westlake (587) and East Hollywood (565).
In recent years, the neighborhoods of Pacoima and Sun Valley have regularly had some of the highest annual illegal dumping totals in the city. In the first quarter of this year Pacoima recorded 521 reports, and Sun Valley had 519.
Homeless encampment calls
The 311 system is how many Angelenos report tent encampments. It is uncertain what result this has—calls might spark a spot clean-up, might help propel an Inside Safe effort that moves people experiencing homelessness into housing, or they might have no impact.
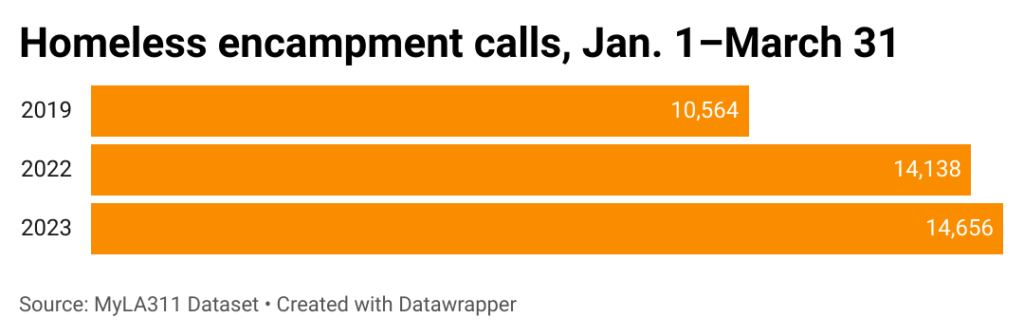
As pandemic pains began to ease, the number of encampment complaints rose, peaking at 16,995 in the third quarter of 2022. In the first quarter of this year, Angelenos made 14,656 encampment reports.

That is similar to the first quarter of last year, though it is 39% higher than the number of reports in the first three months of 2019.
The neighborhood with the most homeless encampment calls in the first quarter this year was Westlake (823). It was followed by Hollywood (715), Koreatown (625) and North Hollywood (609).
How we did it: We examined publicly available MyLA311 service data from Jan. 1, 2019–March 31, 2023. For neighborhood boundaries, we rely on the borders defined by the Los Angeles Times. Learn more about our data here.
Want to know how your neighborhood fares? Or simply just interested in our data? Email us at askus@xtown.la.


