

New report finds more deaths of people experiencing homelessness


In 2022, a total of 2,374 people experiencing homelessness died in Los Angeles County. It marked the eighth consecutive annual increase, and was double the death toll in 2018.
While the number, part of a new report from the Los Angeles County Department of Public Health, is staggering, it also presents a reason for hope: The 7.8% increase over the 2021 count is something of a plateau, and county officials believe efforts to house and treat people experiencing homelessness are preventing even more deaths.
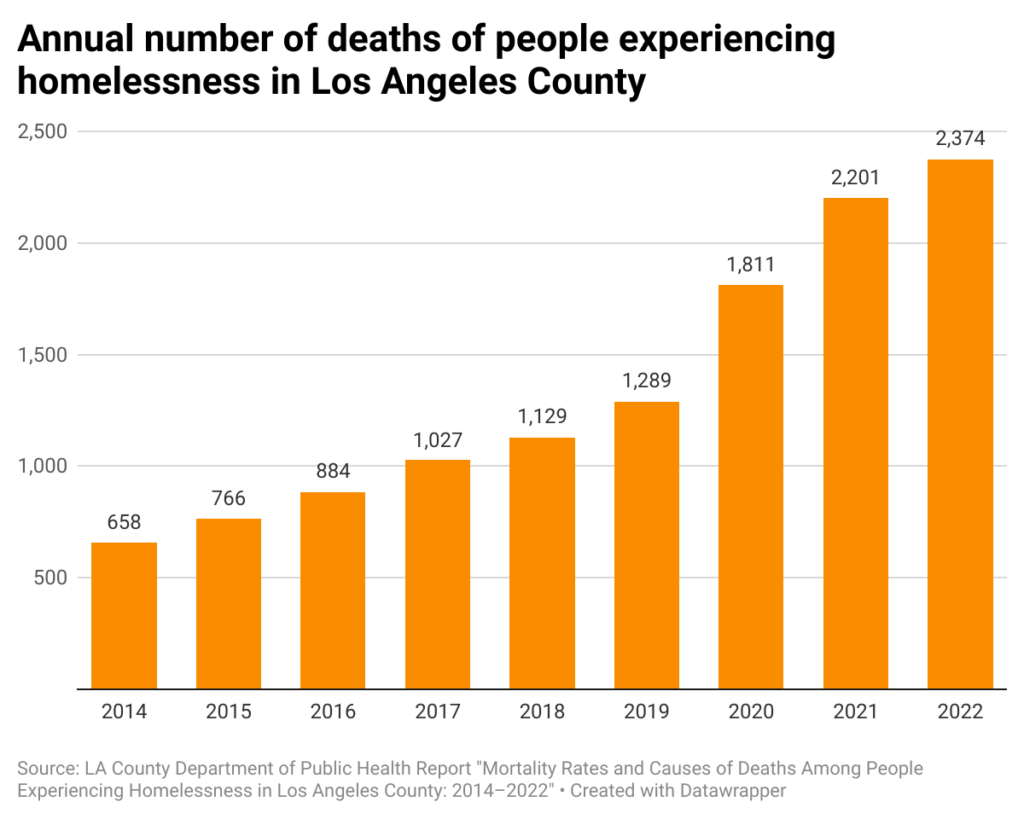
Public Health officials also cited the “all-cause crude mortality rate,” which takes into account the change in the number of people on the streets. That set the 2022 rate at 3,282 deaths per 100,000 people, a 2% increase from the 2021 figure of 3,215.
Dr. Barbara Ferrer, director of the County Department of Public Health, pointed to the dangers facing those on the streets.
“People experiencing homelessness are 40 times more likely to die of an overdose, 18 times more likely to be a homicide victim, and four times more likely to die of coronary heart disease than people in L.A. County’s population as a whole,” she stated in a Thursday morning online presentation of the 37-page report.
[Get crime, housing and other stats about where you live with the Crosstown Neighborhood Newsletter]
The climb in fatalities comes as Los Angeles, like much of the rest of the country, wrestles with a distressing increase in homelessness. The 2023 Homeless Count found there were more than 75,000 unhoused people in Los Angeles County.
According to the new report, “Over the past eight years, the mortality rate among PEH has increased approximately 30% faster than the total population of PEH.”
Flattening the curve on overdoses
Deaths among people experiencing homelessness in the county rose at a steady pace from 2014–2018, then spiked sharply. Department of Public Health data shows that drug and alcohol overdoses, many involving fentanyl, fueled the increase. In 2021 there was a mortality rate of 1,201 overdose deaths per 100,000 people, more than double the count two years prior.
In 2022 the figure was 1,195 deaths.
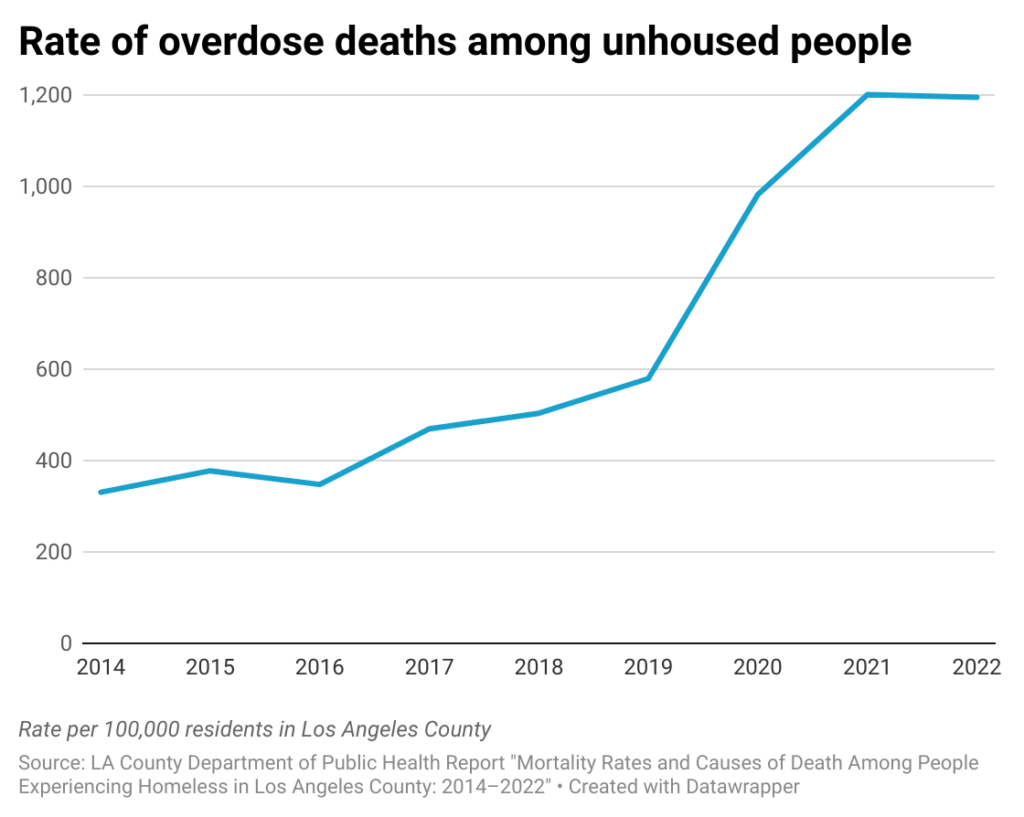
In many instances multiple drugs were determined to be involved in the deaths. The most prevalent was methamphetamine, which was identified in 75.6% of fatalities, up from 63% in 2018.
Fentanyl was found in 67% of deaths last year. That represented a five-fold increase from 2018, when it was seen in just 12.5% of deaths.
Dr. Will Nicholas, director of the Department of Public Health’s Center for Health Impact Evaluation, believes the overall leveling off is tied to work in the field, including more outreach and the availability of drugs that reverse opioid overdoses.
“Based on some data we have on naloxone distribution, we have good reason to believe that effort, and our other harm-reduction efforts, have contributed to that flattening of the curve for the overdose deaths,” he said.
The second-leading cause of death among people experiencing homelessness is coronary heart disease. In L.A. County that decreased from 445 fatalities in 2020 to 395 in 2022.
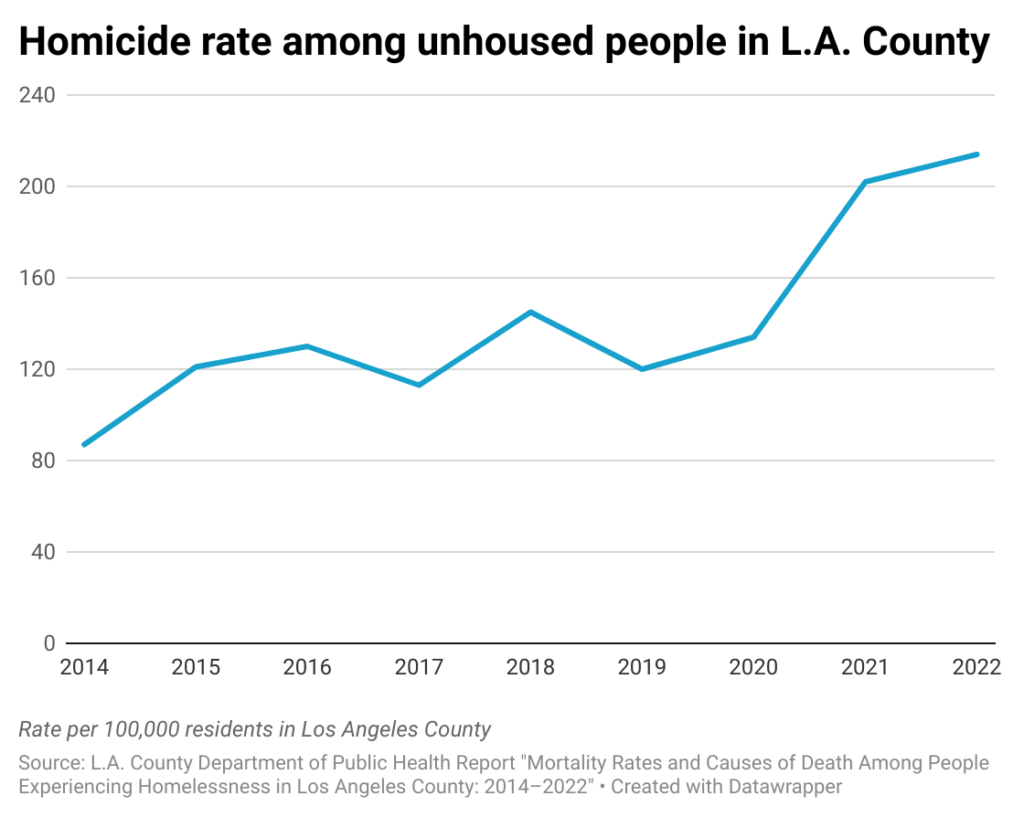
There was a rate of 214 homicides of people experiencing homelessness in the county in 2022, a slight increase from the previous year, but a 60% spike over the level two years prior. That mirrored a general increase in murders in Los Angeles and across the country that coincided with the coronavirus pandemic.
COVID-19 deaths among people experiencing homelessness peaked at a rate of 199 per 100,000 people in 2021. In 2022 the number fell to 39, which Nicholas said put it outside the top 10 causes of death for unhoused individuals in the county.
Danger on the streets and at intersections
The authors of the report said the tallying of deaths and the breakdown of causes requires months of analysis and number crunching of data gathered from across the country. In particular, results from the annual Homeless Count, which comes out in the summer, are used to determine fatality rates.
Figures for 2023 will not be available until next year.
Report authors said the intent is to use the data to determine where unhoused individuals face the most risk, and to offer solutions that can reduce harm and save lives. They come in the form of recommendations that range from continuing to provide more housing, to focused outreach, to expanding telehealth services.
Veronica Lewis, director of the multi-agency Homeless Outreach Program Integrated Care Services, said the benefits of such work are born out by consistency in year-over-year numbers.
“The report clearly shows that you can demonstrate each plateau was connected to actual intervention,” she said.
That includes an evening out in the third-leading cause of death for unhoused individuals in the county: transportation-caused fatalities. The rate of 245 deaths per 100,000 people in 2022 was slightly below the previous year’s figure.
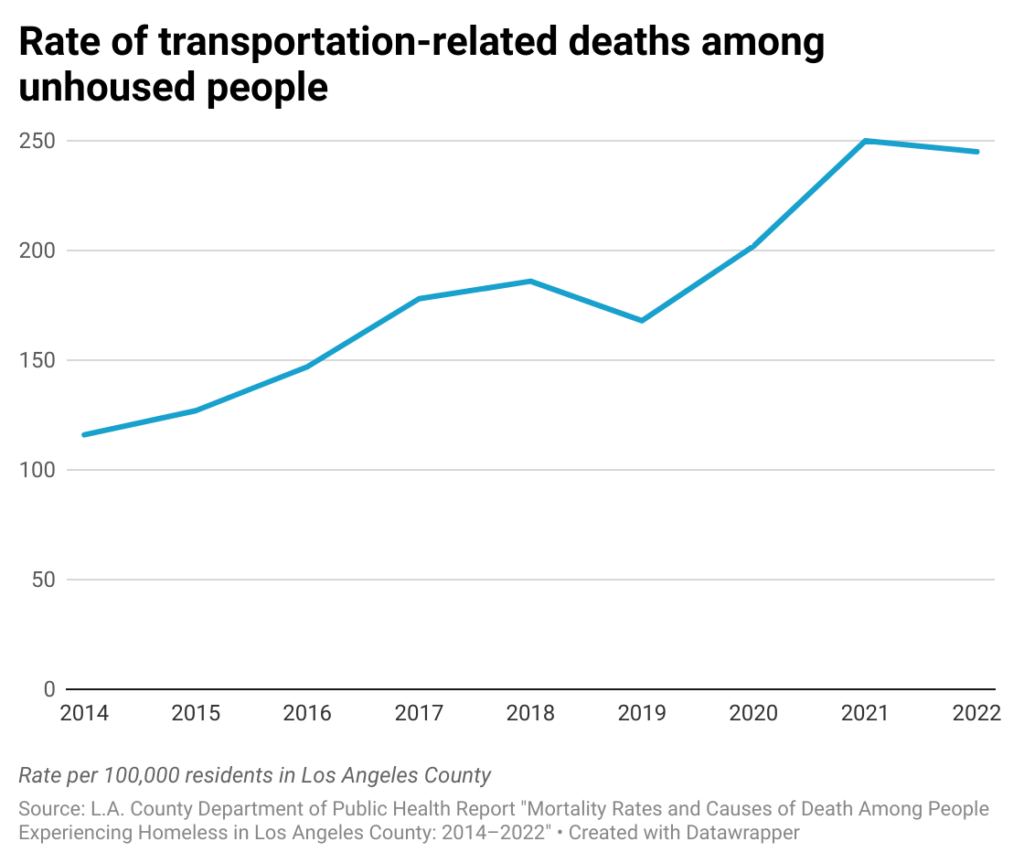
Nicholas attributed the decline, once again, to moving more people off the streets, so they are away from speeding vehicles, and into housing. Still, the report recommends that authorities identify where concentrations of traffic-related deaths occur, and make infrastructure improvements to prevent additional fatalities.
How we did it: We examined data from the Los Angeles County Department of Public Health presented in the report Mortality Rates and Causes of Death Among People Experiencing Homelessness in Los Angeles County: 2014–2022. Learn more about our data here.
The data only reflects information presented in the report. Figures may be updated. Those revised reports do not always automatically become part of the public database.
Have questions about our data or want to know more? Write to us at askus@xtown.la.


