

Los Angeles on pace to again exceed 300 annual traffic fatalities


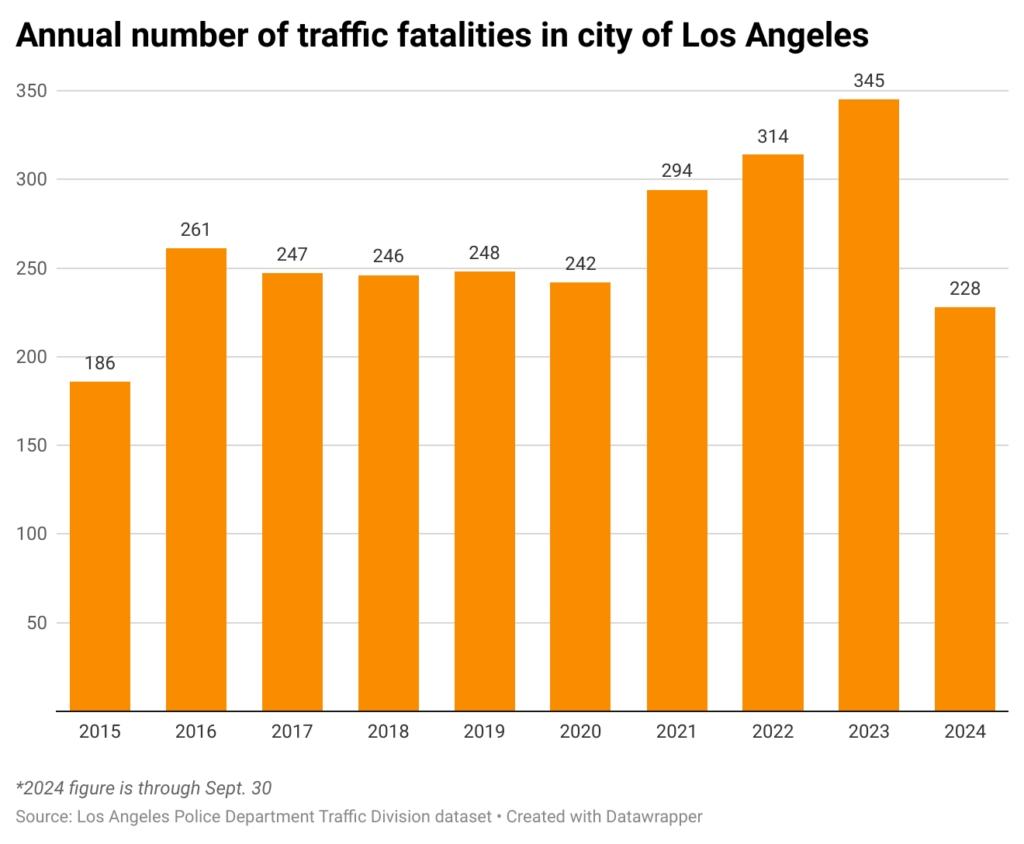
The city of Los Angeles is on pace to suffer more than 300 vehicle-related deaths for the third consecutive year. Although the number of traffic fatalities in the first nine months of 2024 declined slightly from the same period last year, the situation on the roads remains more dangerous than at any time in the 2010s.
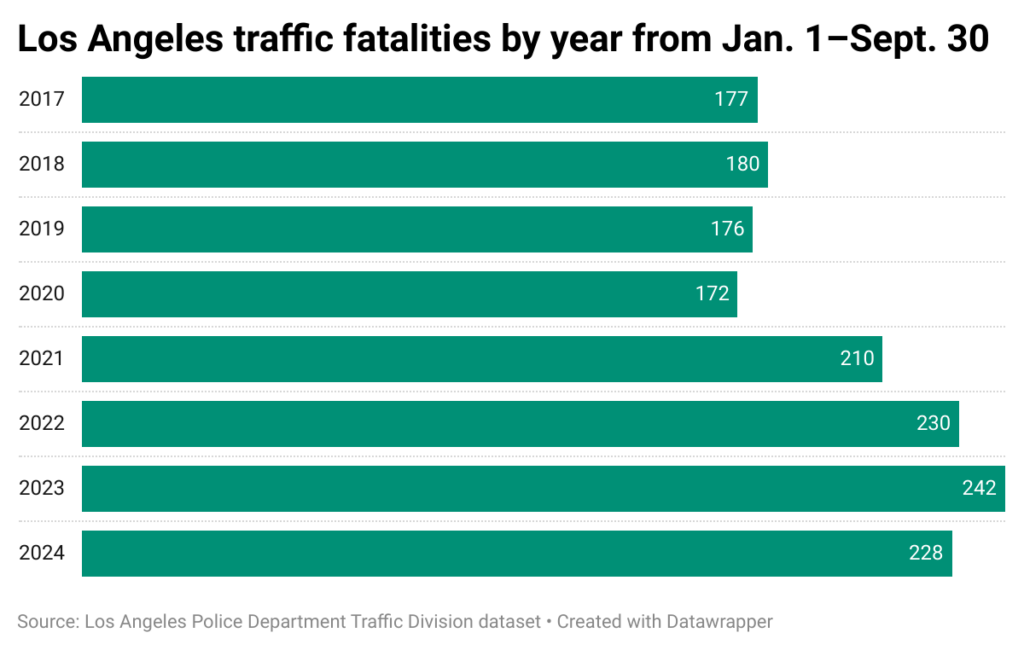
From Jan. 1–Sept. 30, there were 228 vehicle-related fatalities in the city, according to publicly available Los Angeles Police Department Traffic Division data. That is 14 fewer deaths than in the same time frame in 2023.
[Get crime, housing and other stats about where you live with the Crosstown Neighborhood Newsletter]
While the current count is virtually unchanged from 2022, it represents a 29.6% increase from the first nine months of 2019.
Los Angeles made headlines last year, when the 345 traffic deaths exceeded the 327 murders in the city. There was an increase of more than 50 vehicle-related fatalities in just two years.
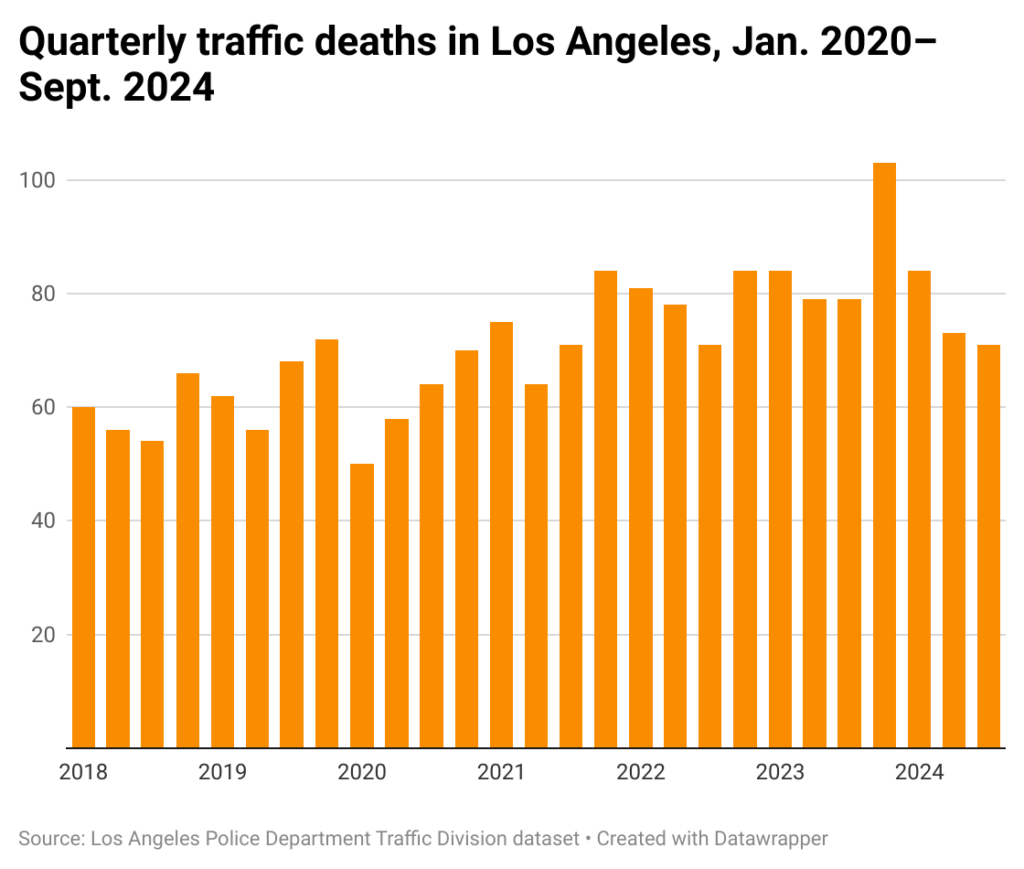
The current situation is made more tenuous by seasonal trends. From 2018-2023, the period from October–December produced the highest quarterly fatality count each year.
A grim peak was reached in the final quarter of 2023, when there were 103 traffic deaths–an average of more than one each day.
If there is a silver lining it may be found in the most recent quarter. The 71 deaths from July 1–Sept. 30 was the lowest quarterly count in two years.
National downs and ups
The slight decline in traffic deaths in Los Angeles this year is in line with a national downturn. In the first half of 2024, there were 18,720 vehicle-related fatalities, according to a report from the National Highway Traffic Safety Administration. That is a 3.2% decrease from the previous year.
Yet current figures are up from before the pandemic. The first six months of 2019 brought 17,025 deaths across the United States. The figure was 15,035 in the first half of 2014.
Numerous factors contribute to the heightened number of people hurt and killed in collisions. Vehicles these days tend to be larger and heavier than in the past, and thus can inflict more damage. There is also poor street architecture and dim lighting in certain communities.
Another element is distracted driving, with people behind the wheel increasingly fiddling with a phone. On other occasions the person staring at the phone is a pedestrian, who looks at a screen instead of any approaching vehicles.
A new study from the University of British Columbia confirms that. A story from UBC News states that the study, “found that distracted pedestrians often remained unaware of their surroundings, making fewer adjustments to their path or speed, which decreased their overall navigational efficiency. This level of distraction can increase the severity of vehicle interaction and near misses by 45 per cent.”
Pedestrian dangers
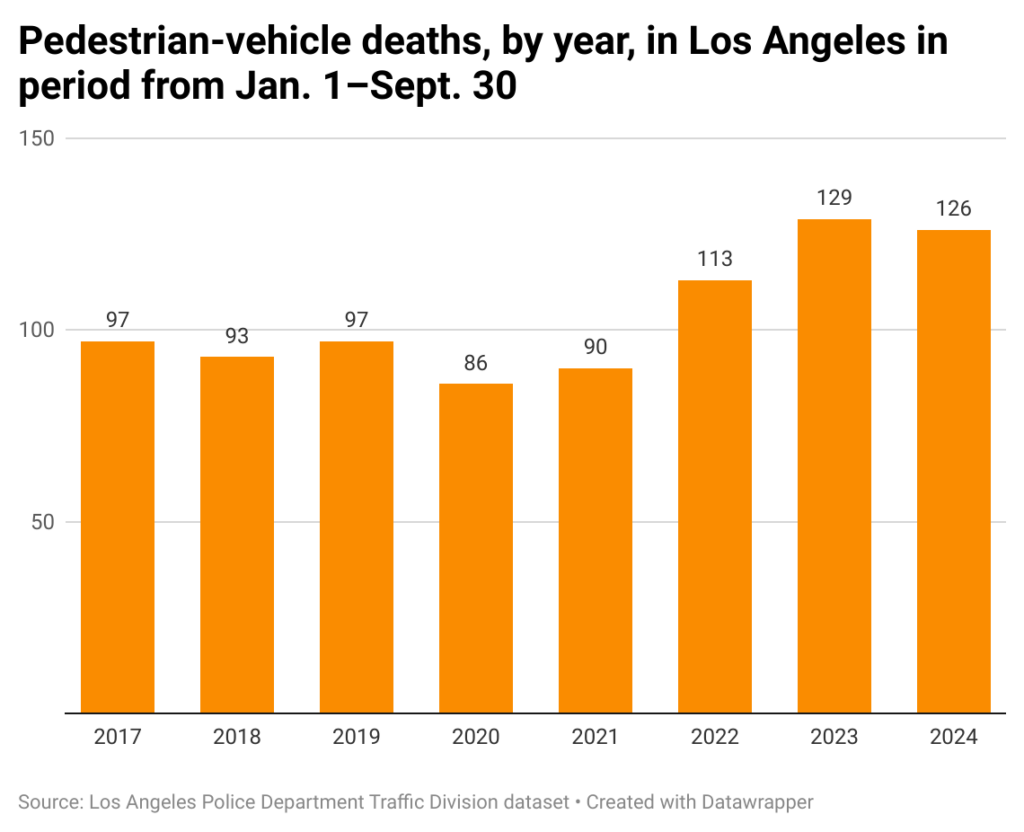
As overall deadly collisions increase, so does the number of pedestrians struck and killed by vehicles. Last year there were 185 such fatalities, accounting for 54% of all vehicle-related deaths.
In the first nine months of 2024, 126 people died in pedestrian-vehicle collisions. While that is similar to the count last year, in the same period in 2019, just 97 pedestrians died after being struck by a vehicle.
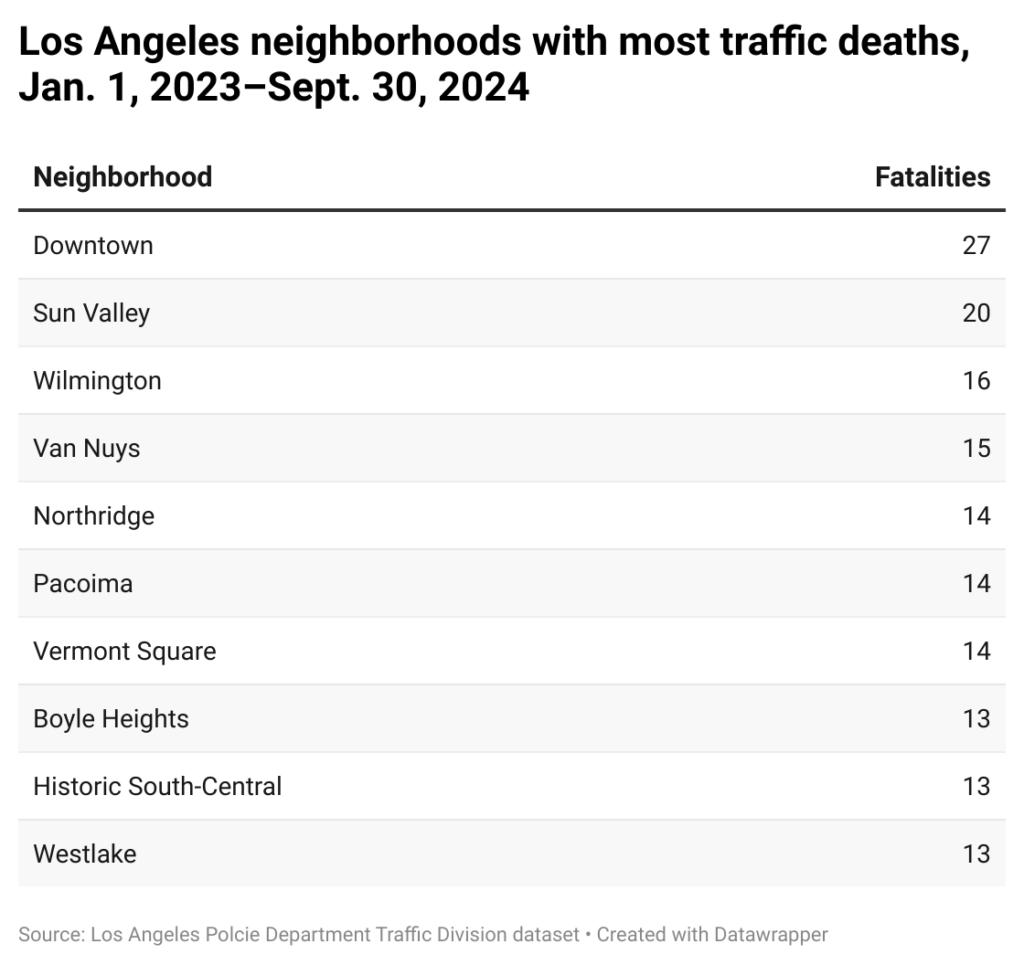
Traffic deaths happen all across Los Angeles. In May in Vermont Square, a 33-year-old woman was killed after a driver making an unsafe turn lost control of their car and jumped a curb, hitting her. In July, a pedestrian died in Venice when they were struck while crossing the street in an unmarked crosswalk.
The community with the most fatal collisions is traffic-filled Downtown, where there have been 27 vehicle-related deaths since the start of 2023. The next-highest count in that time frame is the 20 fatalities recorded in Sun Valley.
How we did it: We examined publicly available collision data from the Los Angeles Police Department Traffic Division from Jan. 1, 2010–Sept. 30, 2024, as well as LAPD Traffic Division Compstat data, and traffic collision data prepared for the Los Angeles Police Commission.
LAPD data only reflects collisions that are reported to the department, not how many collisions actually occurred. In making our calculations, we rely on the data the LAPD makes publicly available. LAPD may update past collision reports with new information, or recategorize past reports. Those revised reports do not always automatically become part of the public database.
Have questions about our data or want to know more? Write to us at askus@xtown.la.


