Is this the calm before the next COVID storm?

Around this time last year, in the weeks after Thanksgiving, the number of people in Los Angeles County who contracted COVID-19 began ticking upwards. Though not as dramatic a rise as in the first winters of the pandemic, the large holiday meals and gatherings seemed to lead to more people getting sick.
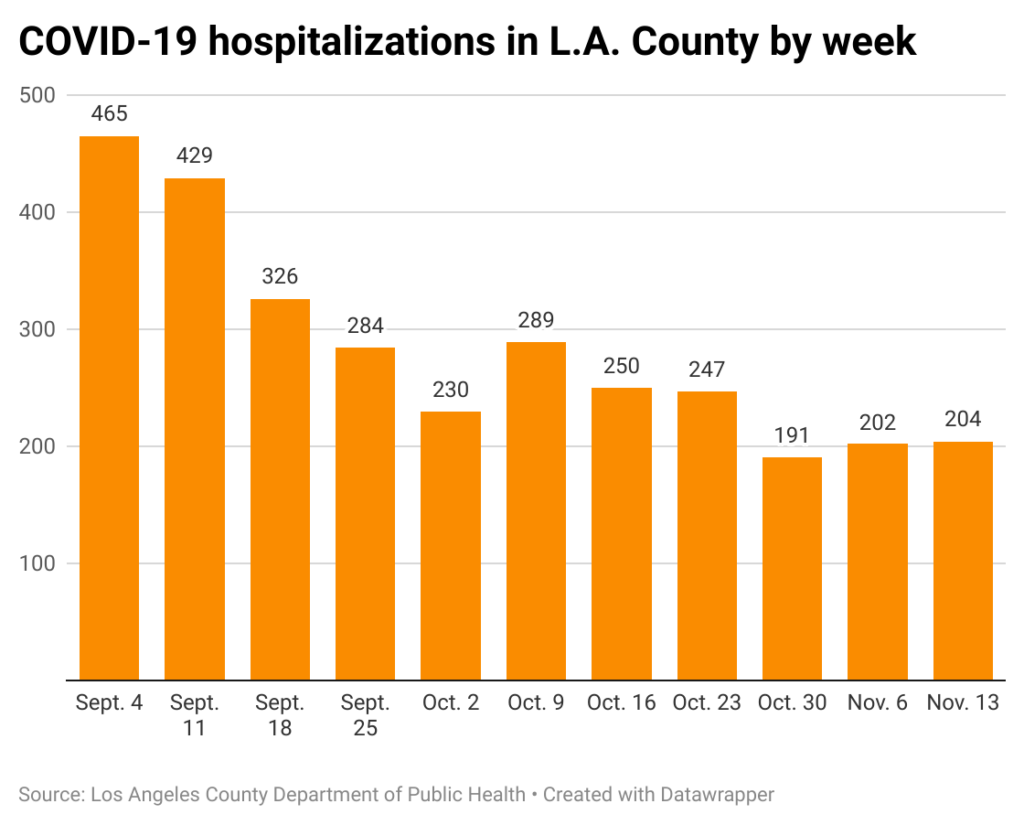
Will the same thing happen again this year? If so, it will start from some of the lowest coronavirus metrics the region has seen in months. According to the COVID-19 data dashboard maintained by the Los Angeles County Department of Public Health, on Nov. 13 there were 204 COVID patients in area hospitals.
A month ago, 250 people were hospitalized. The recent peak was the 497 hospitalizations recorded on Aug. 21. Summer had delivered an unexpected spike in people getting infected.

The concentration of SARS-COV-2 detected in the wastewater system, another reliable indicator of the spread of infections, is slightly higher than it was in the past two weeks. However, it remains at a notably low level: just 9% of the 2023-24 winter peak, according to Department of Public Health data.
By comparison, over the summer that figure had rocketed upwards, and on Aug. 21 reached 87% of the previous winter’s peak.
[Get crime, housing and other stats about where you live with the Crosstown Neighborhood Newsletter]
The Centers for Disease Control and Prevention currently classifies the wastewater concentration in the state of California as Minimal. The national level is at Low (the grading system goes from Minimal to Very High).
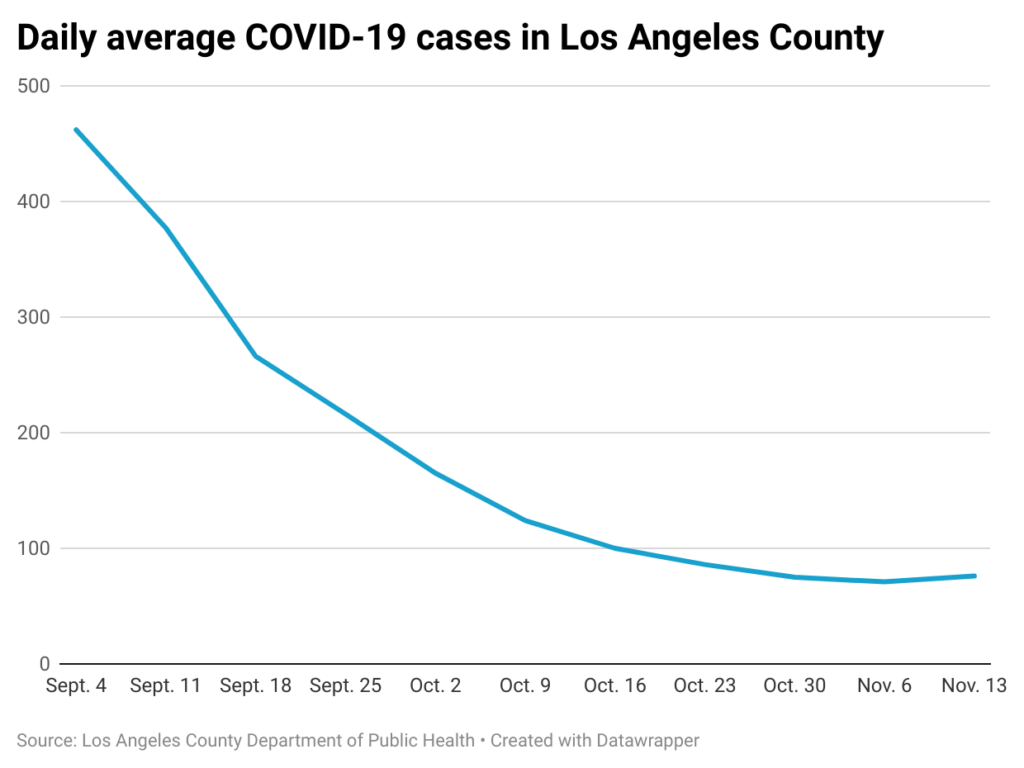
Ever since the widespread adoption of home testing, the number of cases has been deemed an unreliable reflection of COVID’s spread in the community, as many positive results are never reported to health authorities. Still, the weekly caseload count provides context as to whether infections in the region are on the way up or down.
As of Nov. 13, according to Department of Public Health data, the seven-day caseload average in the county stood at 76. It was the fourth consecutive week in two figures.
As with hospitalizations, numbers had been many times higher during summer, surpassing an average of 600 daily cases in early August.

The highest-ever case count was detected on Jan. 9, 2022. Amid the outbreak of the Omicron variant, the Department of Public Health chronicled 45,584 cases that day. On several other days that month the figure was north of 40,000.
In January 2023 there were usually 1,000–2,000 new cases reported each day.
How we did it: We analyzed COVID-19 data through Nov. 13, 2024, related to new cases, deaths, hospitalizations and vaccinations provided by the Los Angeles County Department of Public Health. The data only reflects cases reported to the department, and not how many cases actually occurred. We also examined wastewater concentration data from the Centers for Disease Control and Prevention.
Learn more about our data here. Any questions? Email askus@xtown.la.


