

The Crosstown Crime Book: September


Everyone wants to stay up to date on crime, but it can be hard to know where to get timely and reliable information. With the Crime Book, Crosstown aims to deliver the most important statistics, using publicly accessible Los Angeles Police Department data to provide not just numbers from a single month, but context from the recent past and previous years. Here is how Los Angeles fared in September.
Violence persists
The number of incidents in several key violent crime categories is below the heights of summer, but the level of bloodshed remains well beyond what it was in the years before the pandemic. In September, 39 people were murdered in Los Angeles, the second-highest monthly total in at least a decade. This past July had the most, with 48 homicides. Murders have soared since the arrival of the coronavirus. In fact, the LAPD has now recorded 39 monthly homicides six times just since July 2020. Before that, there had not been 39 or more murders in a single month since January 2012.
Homicides in Los Angeles in the month of September, 2017-2021
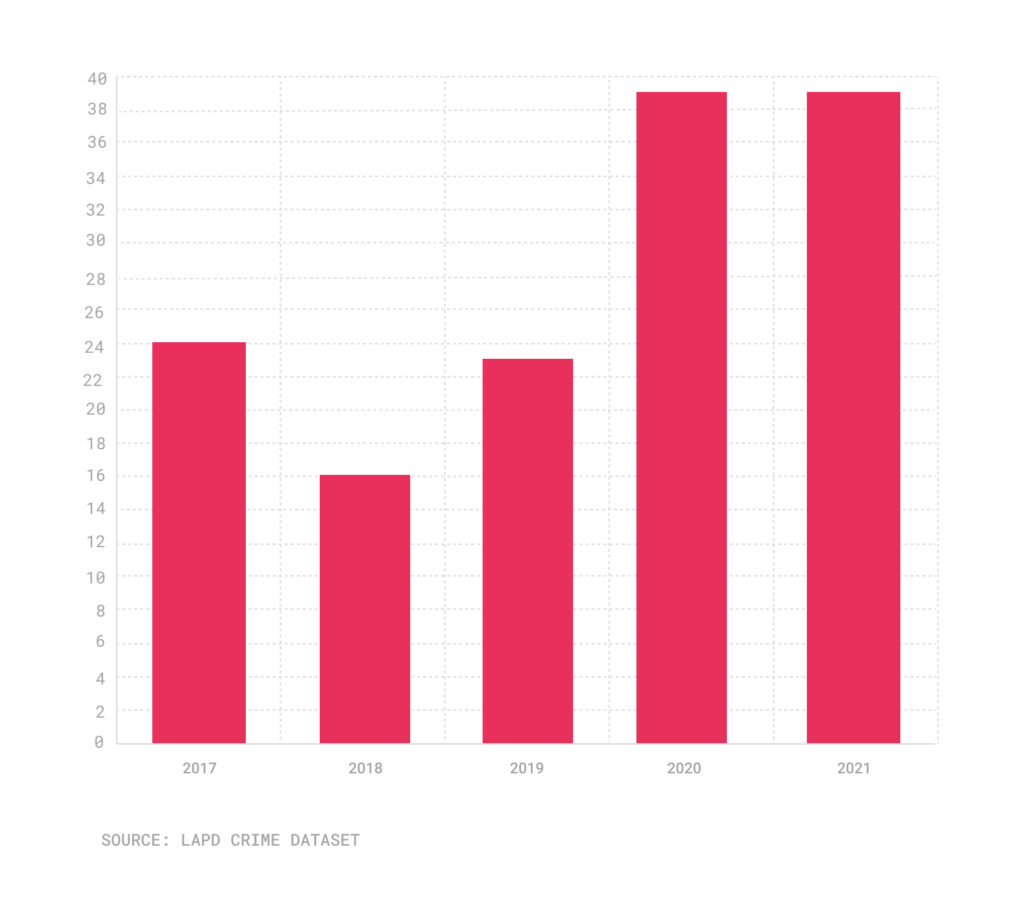
The 39 killings last month is a 69.6% increase over the 23 murders in September 2019.
Through Oct. 2, Los Angeles has seen 299 homicides, according to LAPD Compstat data. That is a 46.6% increase over the same point in the pre-pandemic year of 2019. It puts the city on pace to record approximately 400 murders this year; Los Angeles has not been in this territory since experiencing 395 murders in 2007.
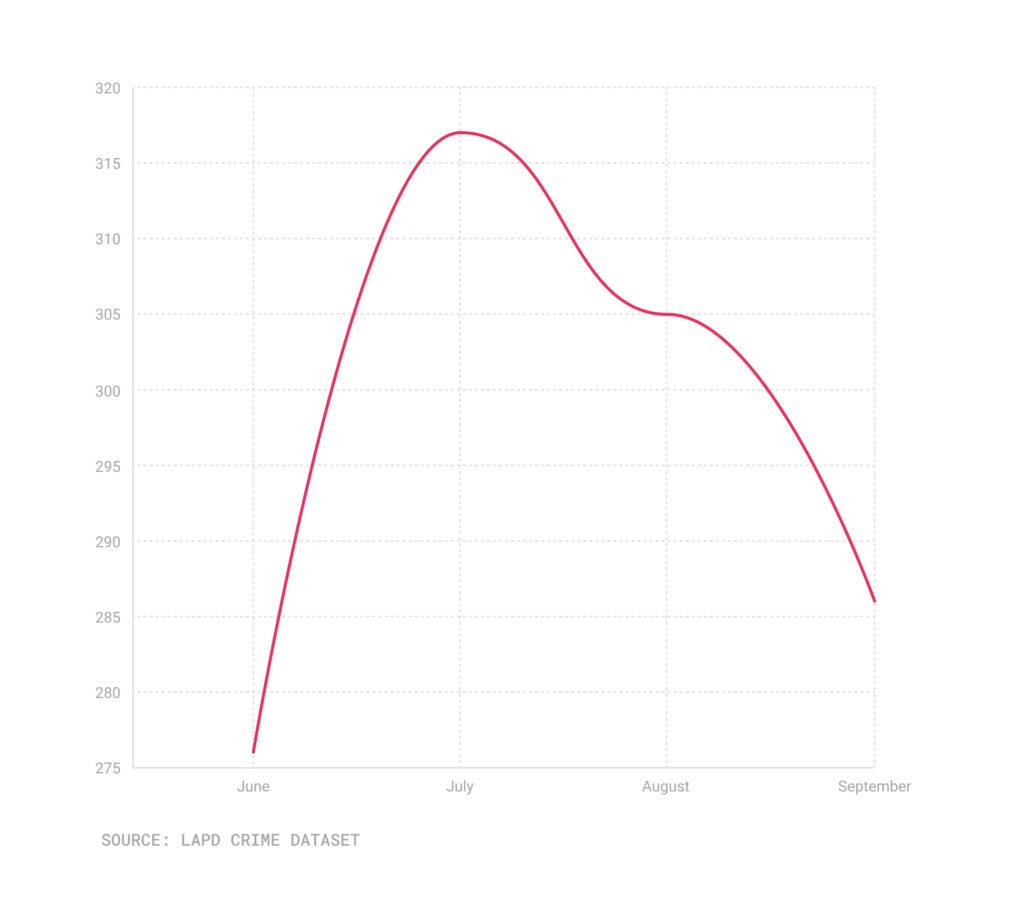
Gun violence is the main driver of the elevated homicide rate. The 286 shots fired in September is slightly below figures from the previous two months, and is also fewer than the 319 reported in September 2020. Yet the number of gunshots remains elevated from prior years; in September 2017, for example, there were 168 shots-fired reports.
Shots-fired reports by month in Los Angeles, June-September 2021
On Oct. 5, Police Chief Michel Moore told the Los Angeles Police Commission that the number of people shot in a recent four-week period is down 15% compared with the same timeframe in 2020. He said the department is analyzing the data.
In the four-week period, he told the commissioners, ”What we have seen is 115 shooting victims, versus 137 in the four weeks last year. So our opportunity here is to understand this 15% reduction.”
[Get COVID-19, crime and other stats about where you live with the Crosstown Neighborhood Newsletter]
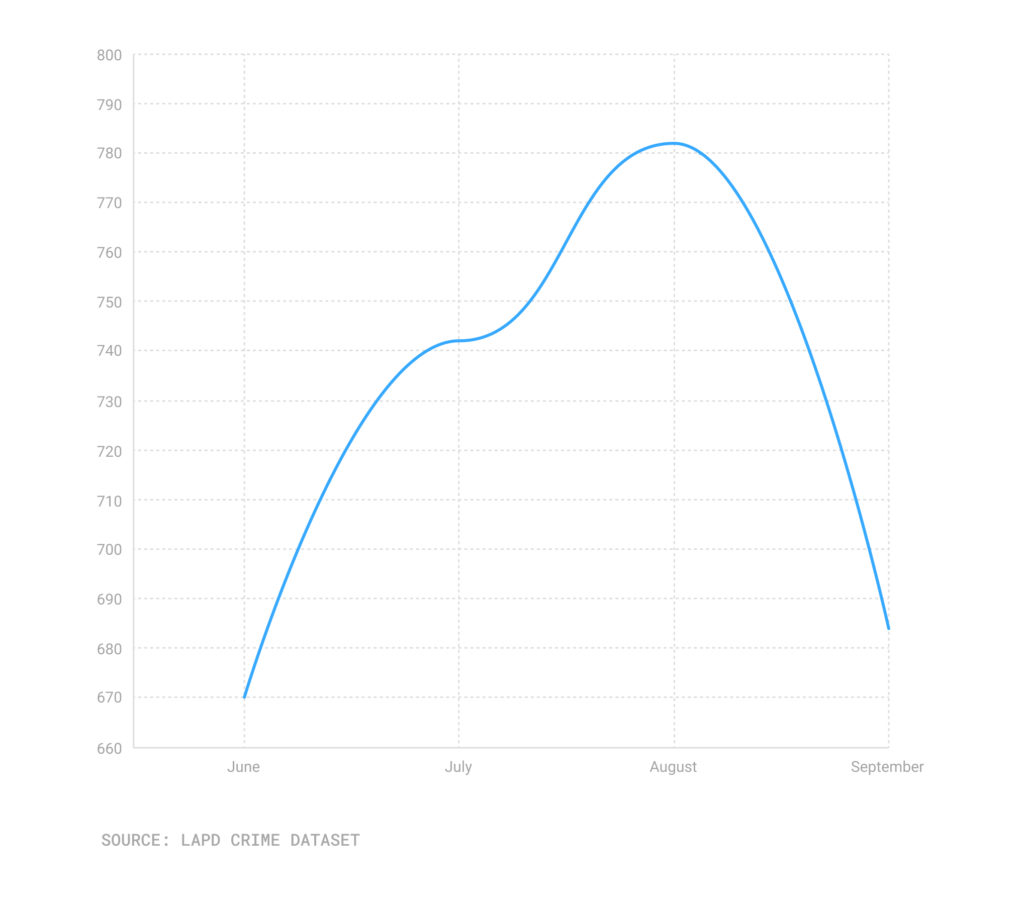
A third violent crime category, robbery, is taking a different course. The 684 incidents in September is similar to the 670 in June (there was a moderate rise in July and August). Yet last month’s figure represents a sizable decrease from the 905 robberies tallied in September 2017.
Robberies by month in Los Angeles, June-September 2021
Robberies in Los Angeles in the month of September, 2017-2021
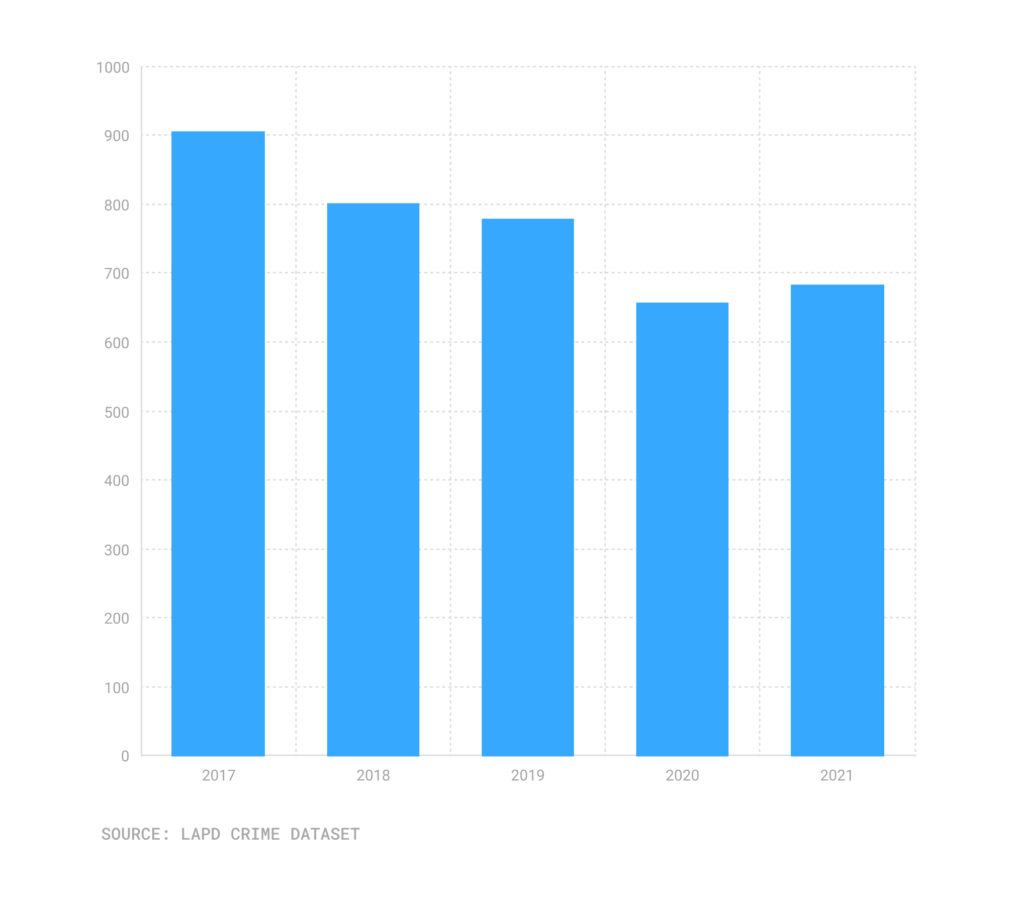
The 6,090 robberies committed in Los Angeles through Oct. 2 is 15.4% below the figure at the same time in 2020. Still, any positive feelings are tempered. Crosstown in the spring reported that guns are increasingly being used during robberies, which may help explain the overall 25.2% increase in shooting victims the city has experienced this year.
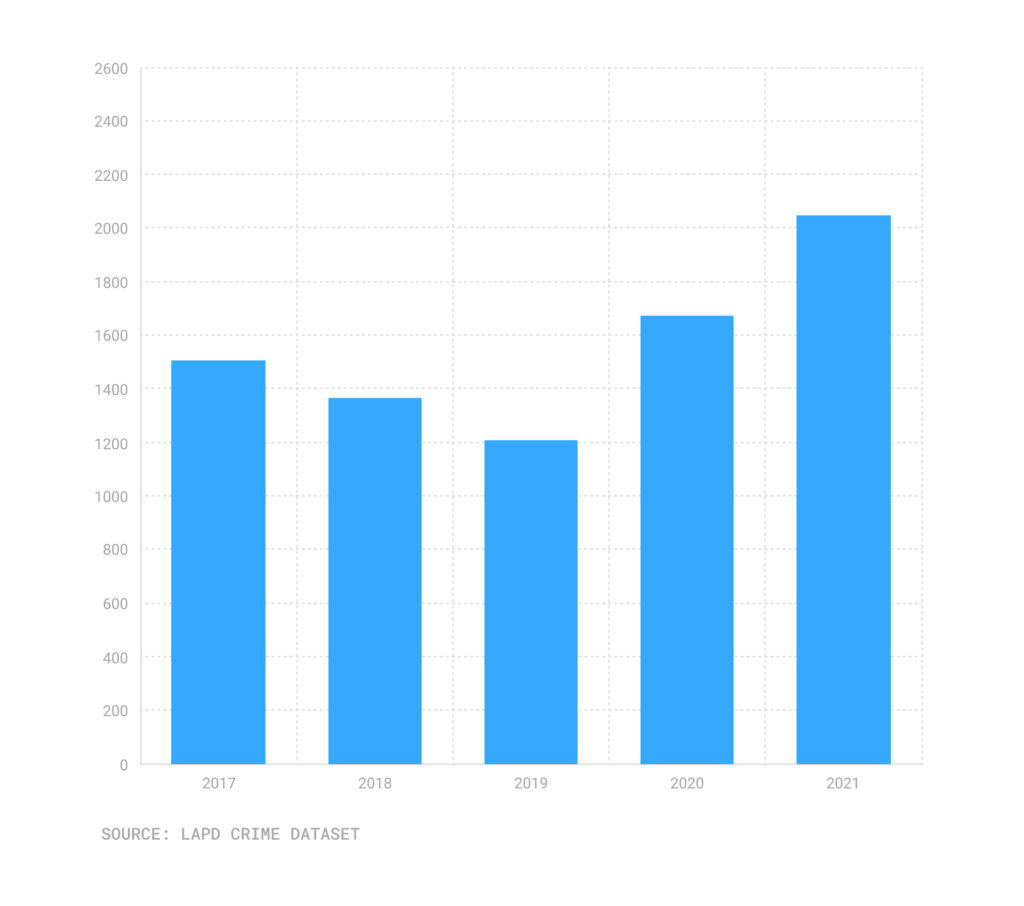
Vanishing vehicles
Car thefts have been something of an epidemic since the start of the pandemic. Yet, while COVID-19 infections are now waning, car thieves are shifting into an even higher gear. Vehicle thefts have increased every month since June, and the 2,049 vanishing vehicles in September marks a 22.6% increase over the 1,671 in the same month last year.
Vehicle thefts in Los Angeles in the month of September, 2017-2021
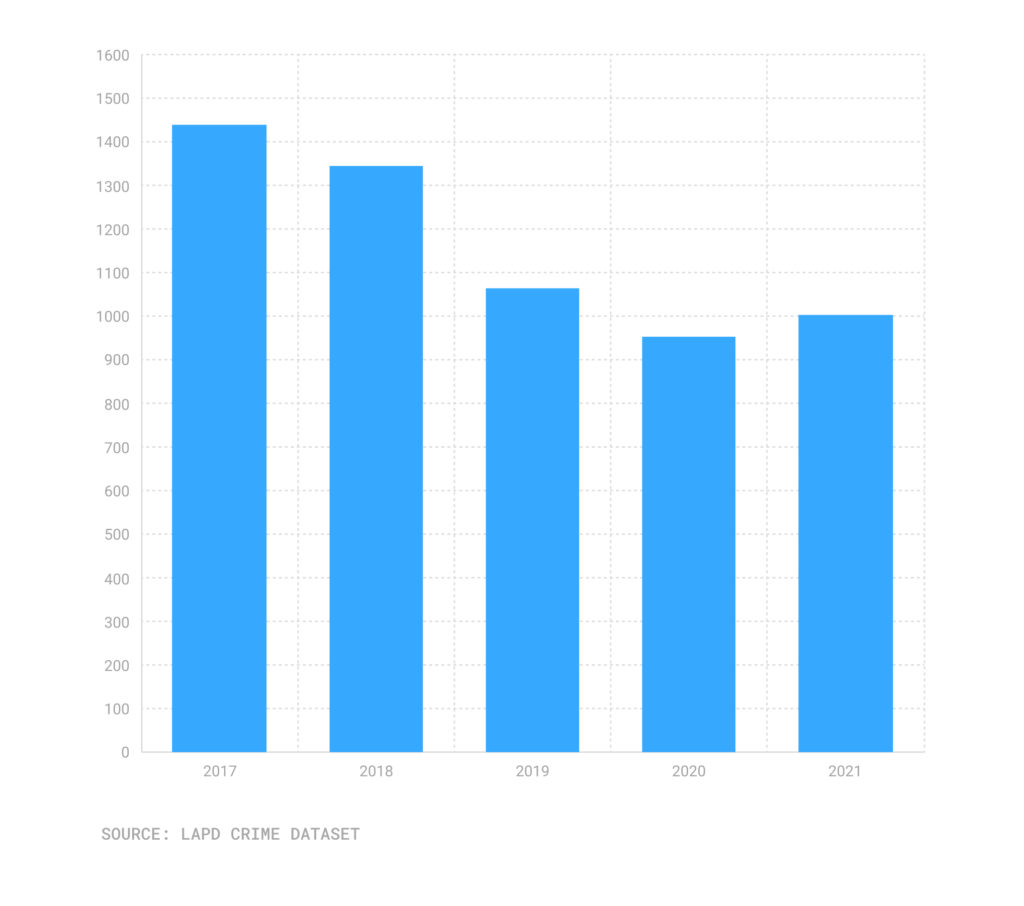
Property crime is one of the few categories that appears to be on a slightly positive trajectory. The 1,001 burglaries last month is a 30.3% decline from the 1,437 in the same month in 2017. Burglaries have been fairly flat in the city during the summer, with the September count similar to the 1,046 recorded in June.
Burglaries in Los Angeles in the month of September, 2017-2021
Altogether, there have been 64,871 property crimes in the city through Oct. 2, according to LAPD Compstat data. That is down 1.5% from the same time last year, and 9.3% below the level in 2019.
How we did it: We examined publicly available crime data from the Los Angeles Police Department from June 1-Sept. 30, 2021, and the periods of Sept. 1-30 from 2017-2021. Learn more about our data here.
LAPD data only reflects crimes that are reported to the department, not how many crimes actually occurred. In making our calculations, we rely on the data the LAPD makes publicly available. LAPD may update past crime reports with new information, or recategorize past reports. Those revised reports do not always automatically become part of the public database.
Want to know how your neighborhood fares? Or simply just interested in our data? Email us at askus@xtown.la.


