

Los Angeles’s true crime story for 2021


Murders. A huge heist at a Nordstrom. The sound of gunfire. Crime is clearly on the rise in Los Angeles. Or is it?
At Crosstown, we look closely at the data to discern a more precise picture of public safety in the city. The truth about 2021: It’s complicated.
In many respects, the city is safer than it was several years ago, and much safer than it was 20 years ago. Some crimes are hitting historic lows. At the same time, certain violent crimes, including murder, are rising at alarming rates. Whether Los Angeles feels safe to you depends on where you live, work and what time you’re out and about.
We’ve compiled a series of charts to illustrate the truth about crime in the city using up to 12 years of data from the Los Angeles Police Department. (The data is a record of all crimes that were reported, not all crimes that took place. You can learn more about our data here.) The nearly two years of COVID-19-induced lockdowns and disruptions have impacted crime as well. That’s why in some cases comparing 2021 to the pre-pandemic year of 2019, rather than 2020, offers a more complete picture.
Is crime actually down?
Well, yes, when compared with 2019. There were a total of 204,205 crime reports in Los Angeles last year, everything from vandalism to stolen cars to homicide. That’s a 4.9% increase from 2020, when the city spent several months on lockdown. But it’s 5.4% below 2019.
The two pandemic years, 2020 and 2021, brought the two lowest numbers of citywide crime since 2015.
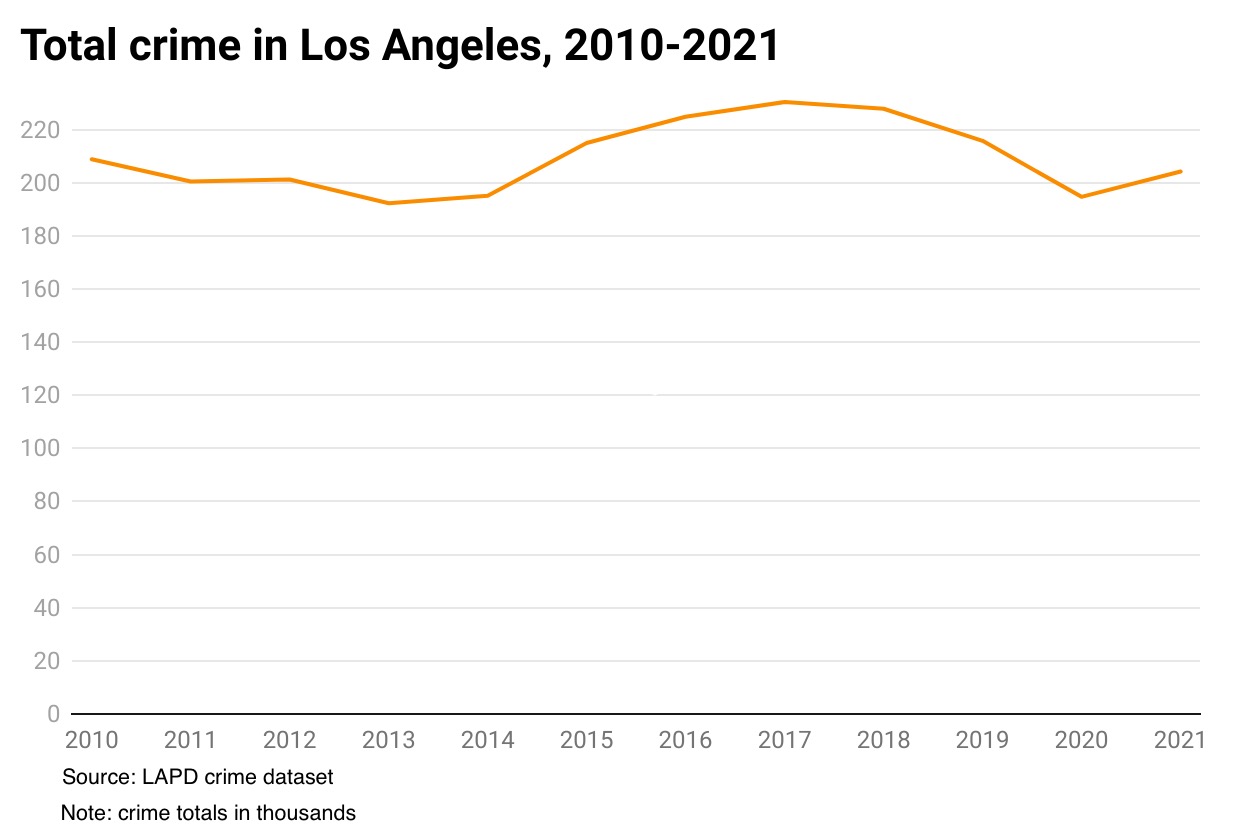
But crime varies from neighborhood to neighborhood. Last year, 73 of Los Angeles’s 110 communities registered an increase in crime, two saw no change, and 36 experienced a decrease. Elysian Park, Westchester, University Park and Larchmont each had increases of 20% or more compared with 2020.
Meanwhile, Bel-Air, Mission Hills, Tujunga and Vermont Square saw dips of more than 10% compared with 2020.
Homicides
Los Angeles is confronting a murder crisis. There were 48 homicides in July, the most of any month since at least 2010. Last year, the city recorded 397 murders, more than any time during the past 14 years.
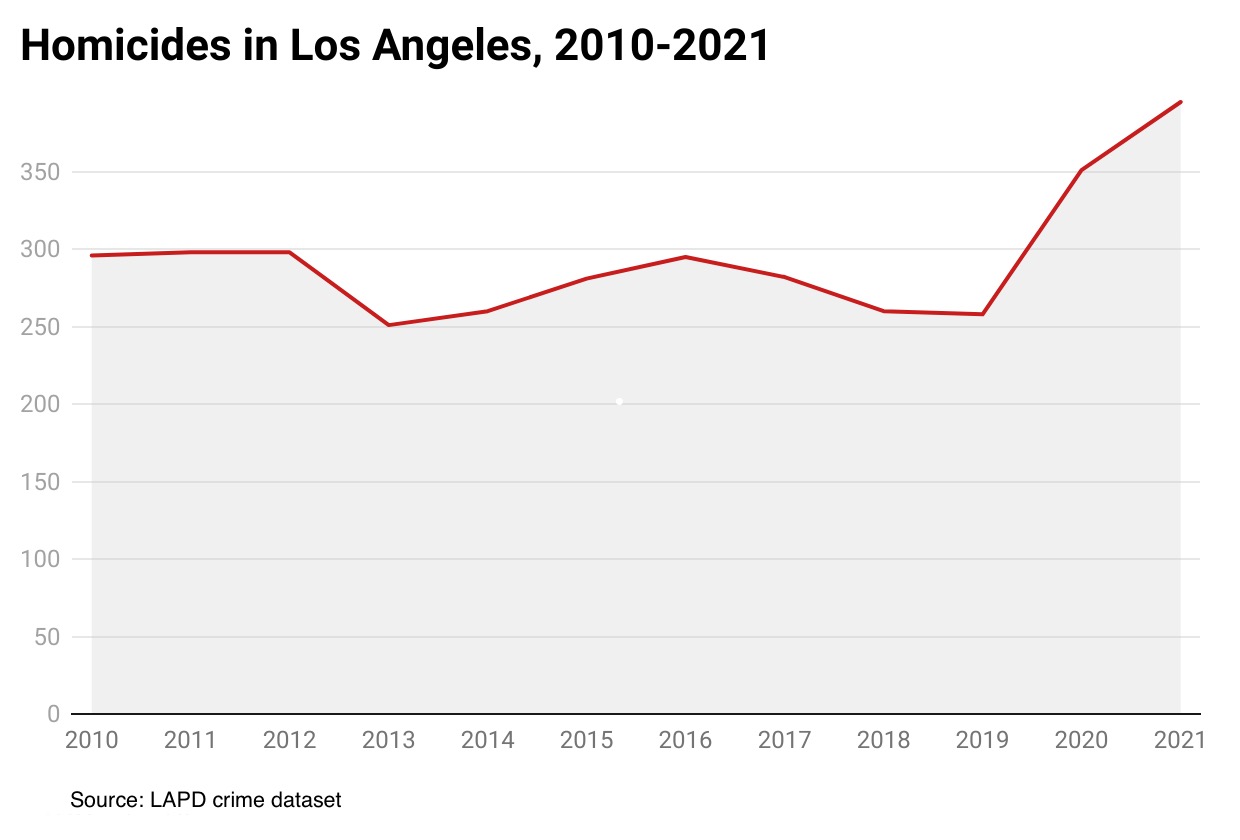
Other major cities have also experienced an increase in homicides. LAPD Chief Michel Moore blames the ready availability of firearms, including ghost guns (untraceable weapons, some of which are manufactured using 3-D printing).
The pain is not distributed equally. Downtown had by far the highest number of murders, with 29, followed by Watts, with 23.
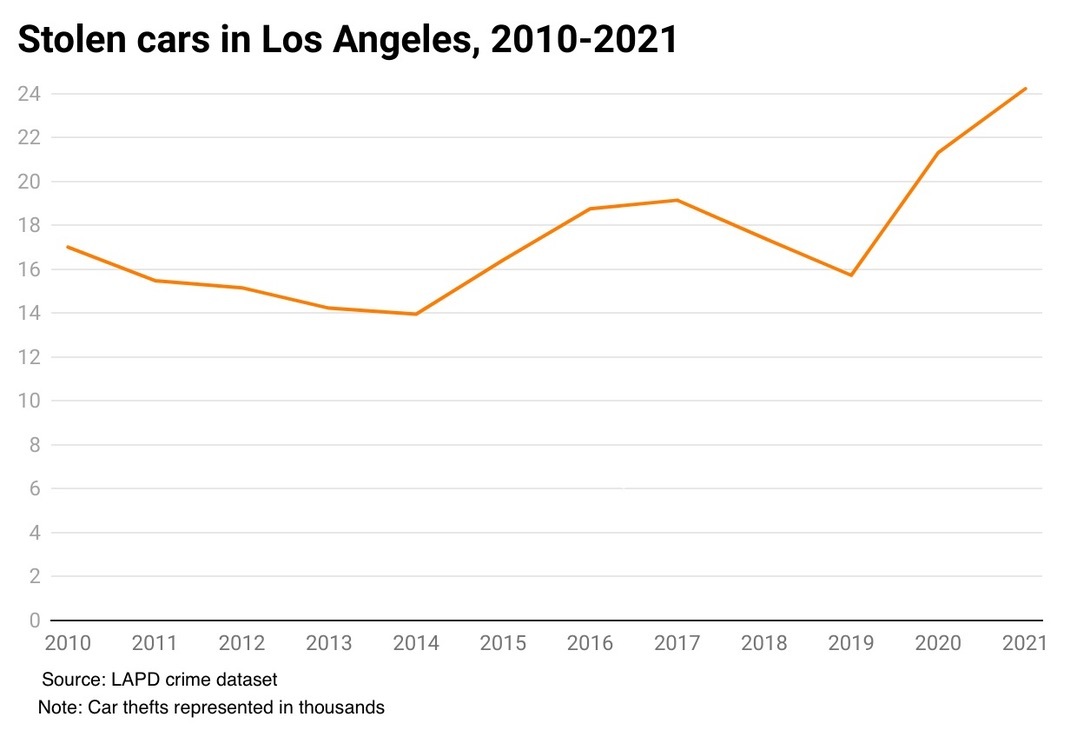
Your car got stolen?
As soon as the lockdown arrived in March 2020, the number of cars disappearing from streets began to spike. The pace has not slowed down even as driving picked back up, and the last quarter of 2021 brought more stolen car reports than any time in the past 12 years. A small consolation: Many of the stolen vehicles are recovered within a few days, sometimes just blocks from where they were taken.
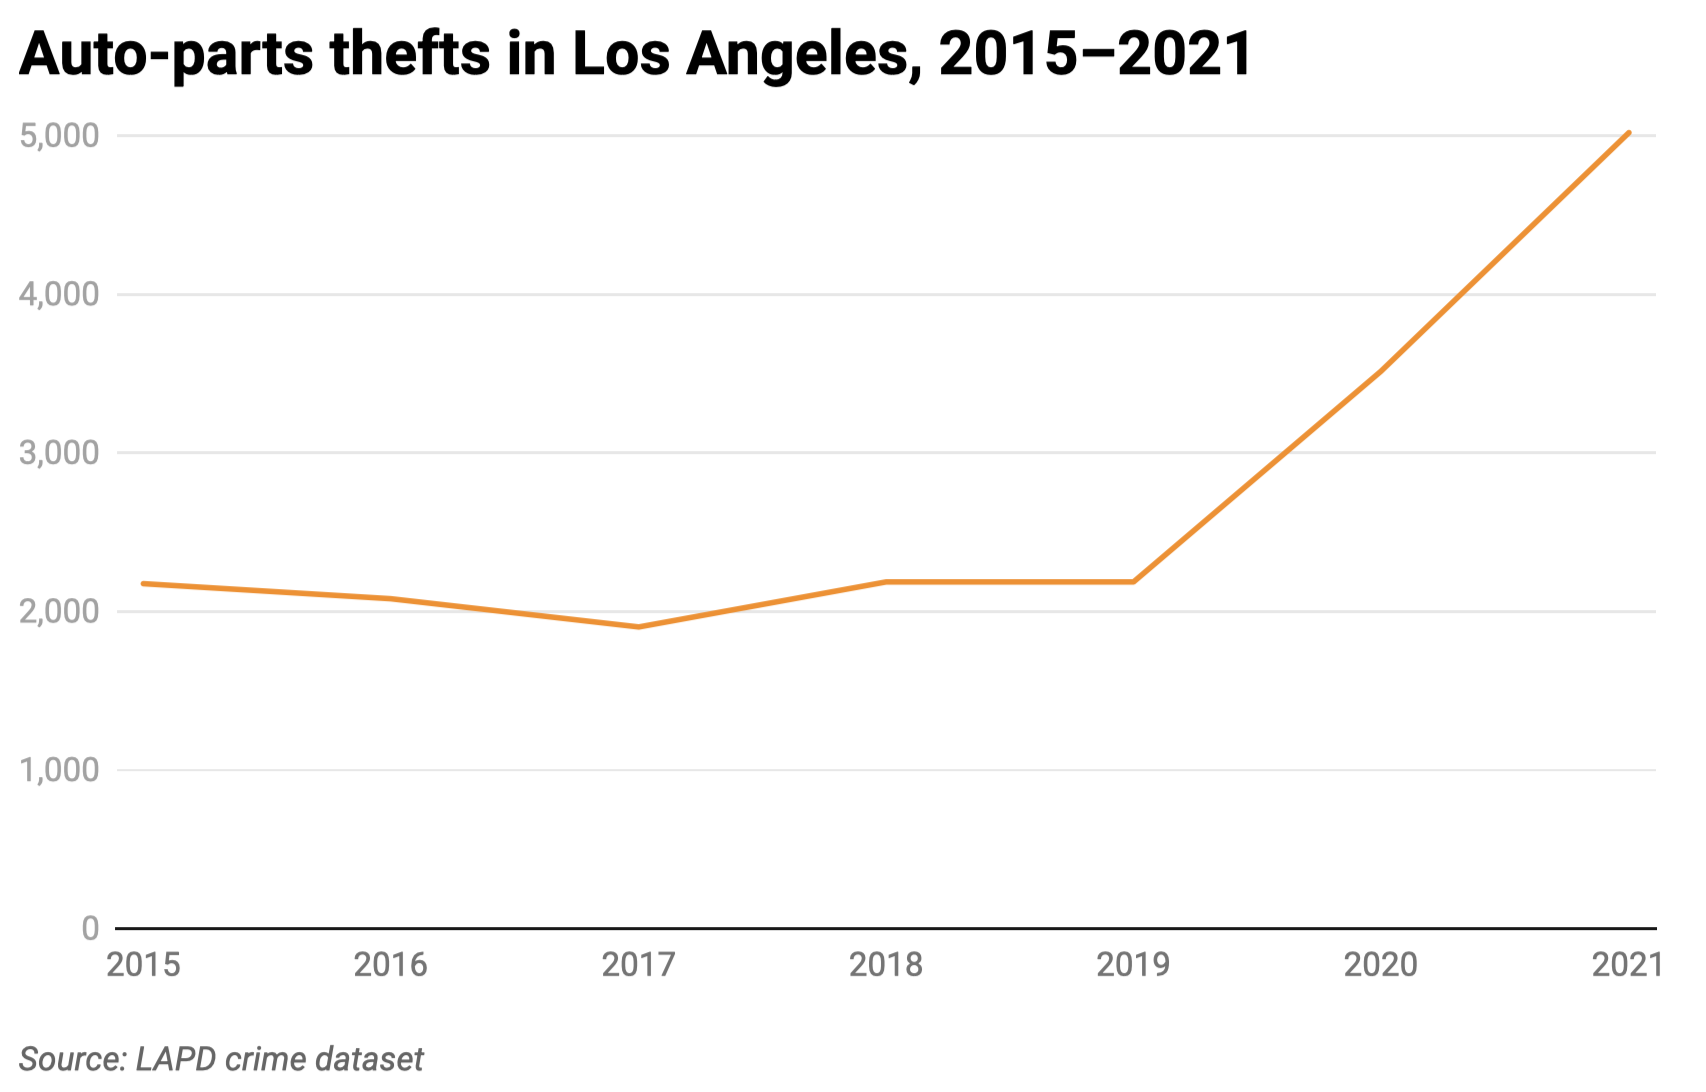
They stole your catalytic converter?
You might think, why go to all that trouble? But it’s happening like never before. Catalytic converters, air bags and other parts are being ripped out of parked cars. A stolen catalytic converter can be melted down for precious metals that will fetch several hundred dollars. Your bill to replace it could easily be over $2,000.
Your home is safer
Los Angeles recorded its lowest rate of burglaries in at least 12 years. There were 12,747 reports of burglary last year, down about 6% from 2020. Breaking and entering a home or business has been on a fairly steady decline since 2017.
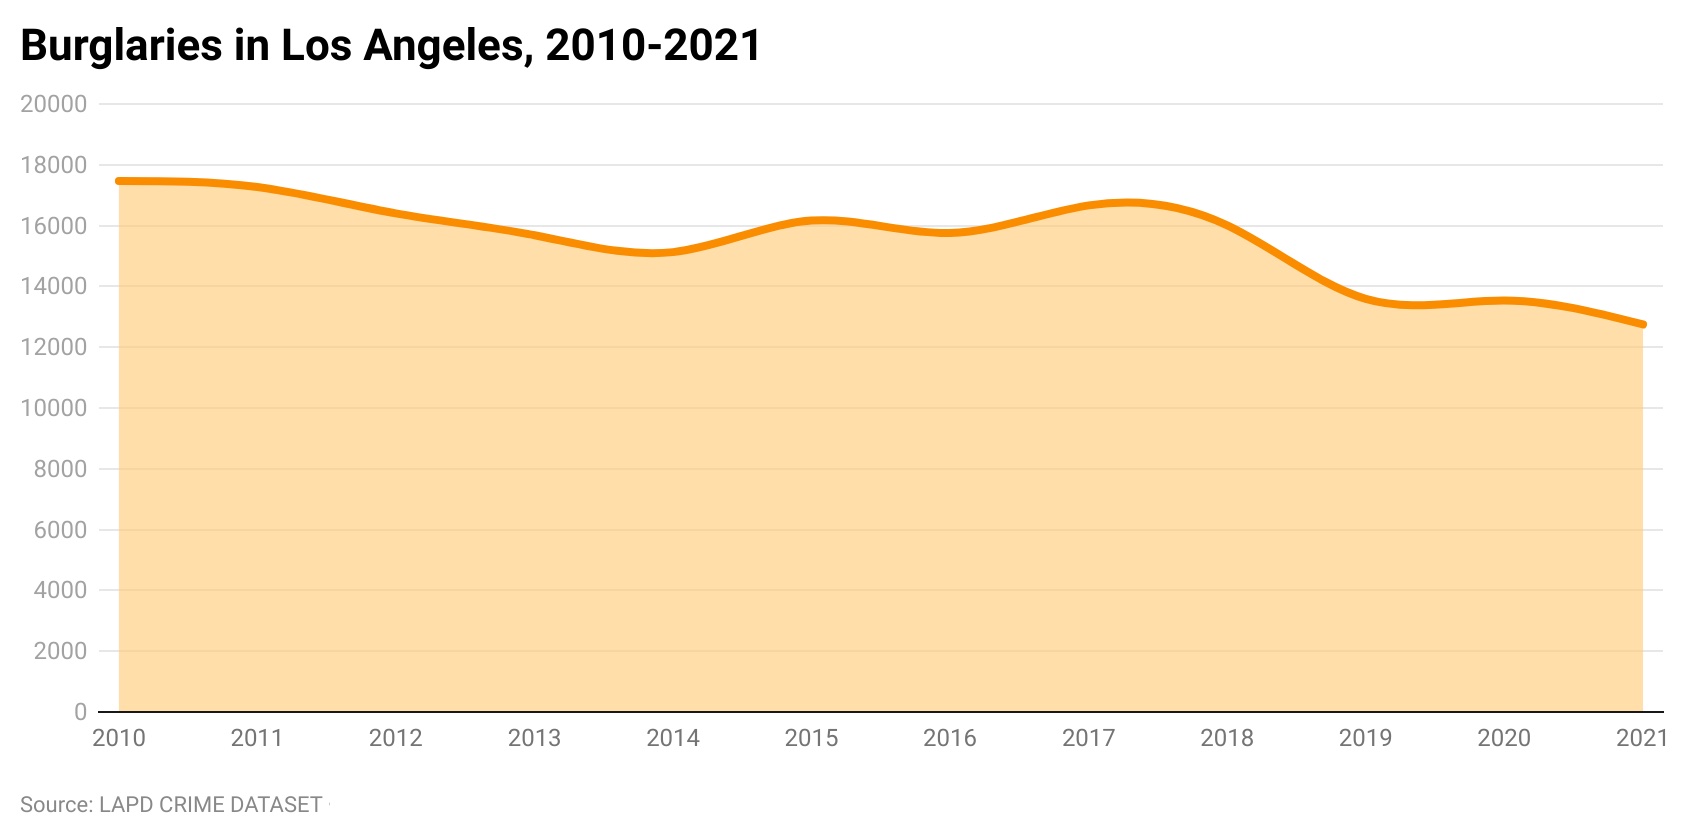
Don’t tell that to the folks in Beverlywood. The neighborhood had a 93% increase in burglaries last year compared with 2020. But the neighborhoods with the highest burglary rate (reports per 100,000 residents) were Downtown and Venice.
Robbery is down
Maybe you saw the headlines about the smash-and-grab robbery at a high-end boutique. Robberies definitely made news, but fewer of them are being reported than during the pre-pandemic period. There were 8,479 robberies reported last year, a slight uptick from 2020. But the number is down 12.4% from 2019.
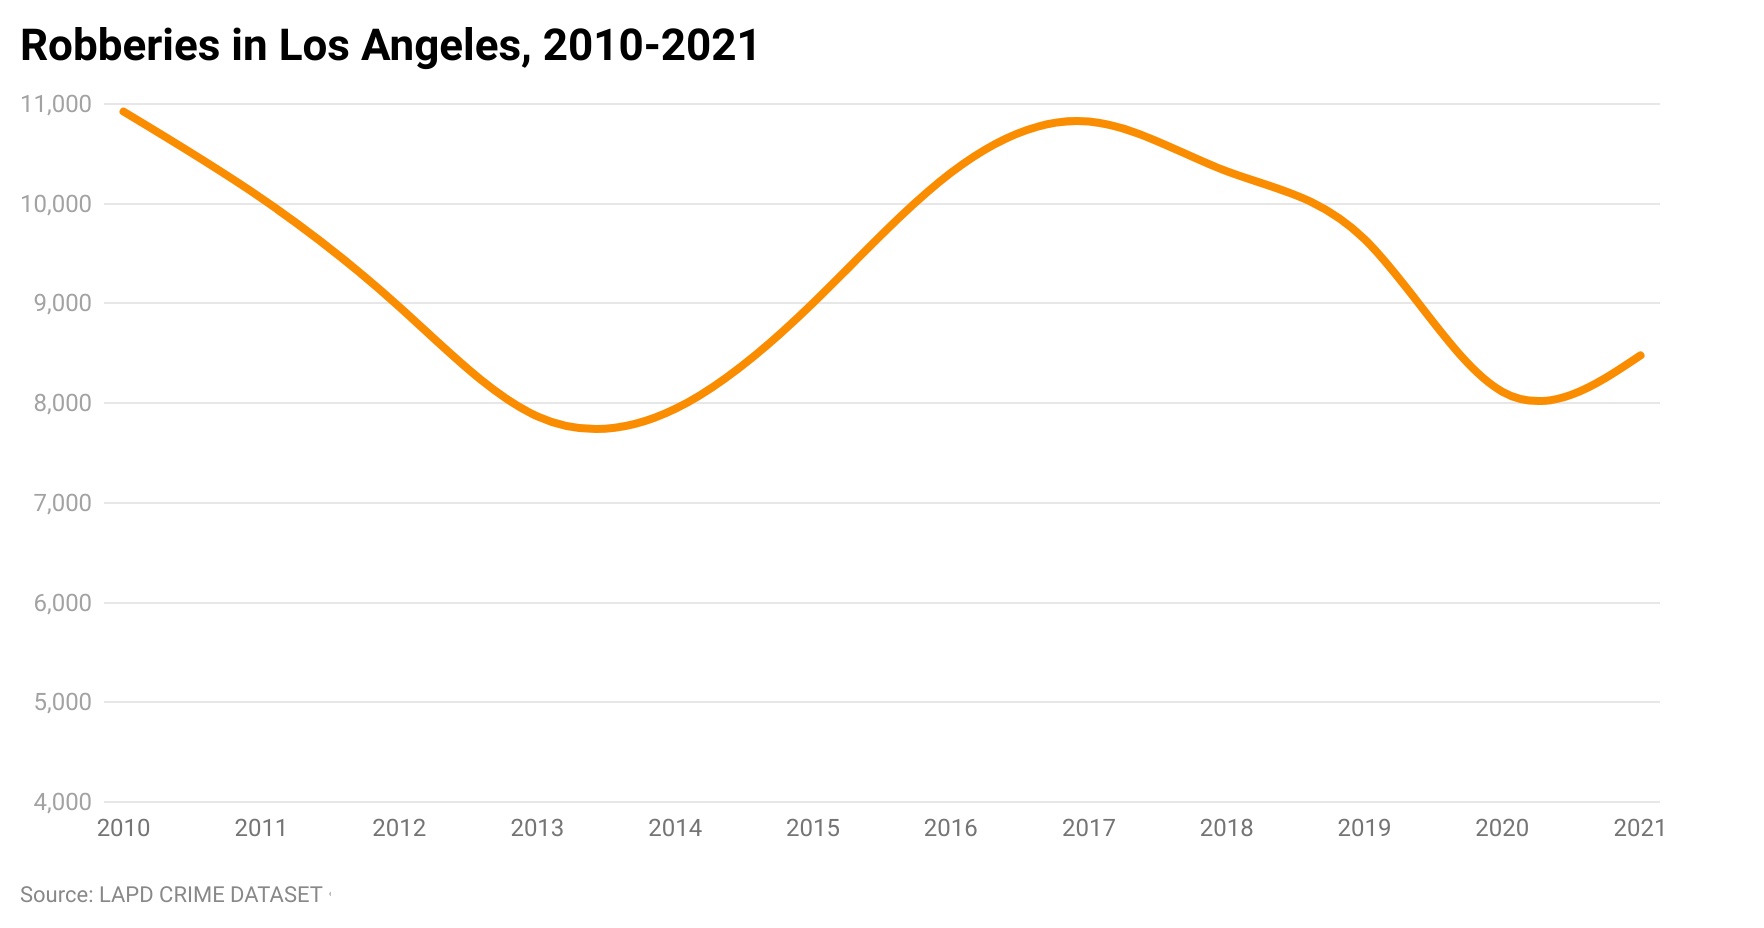
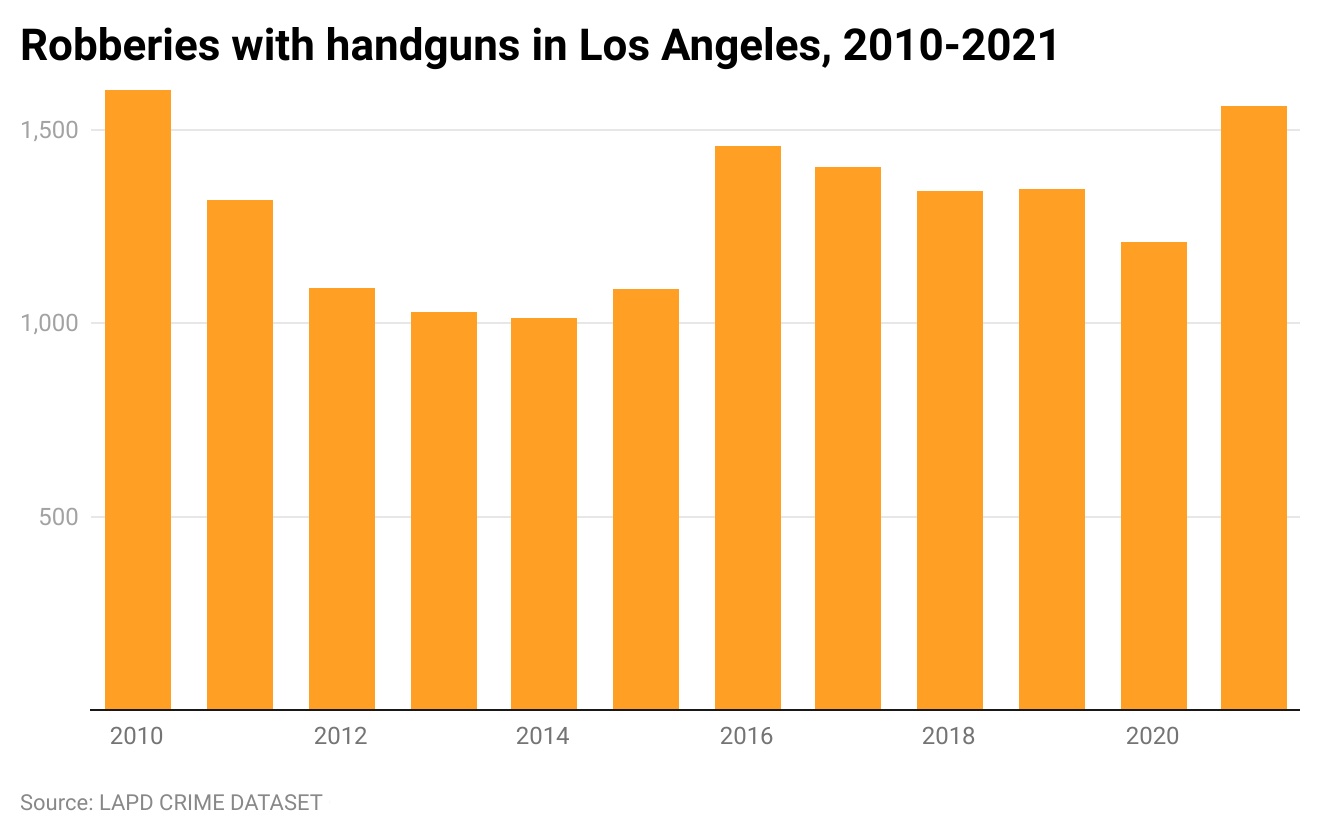
The bad news: There are more armed robberies taking place. In fact, the most since 2010.
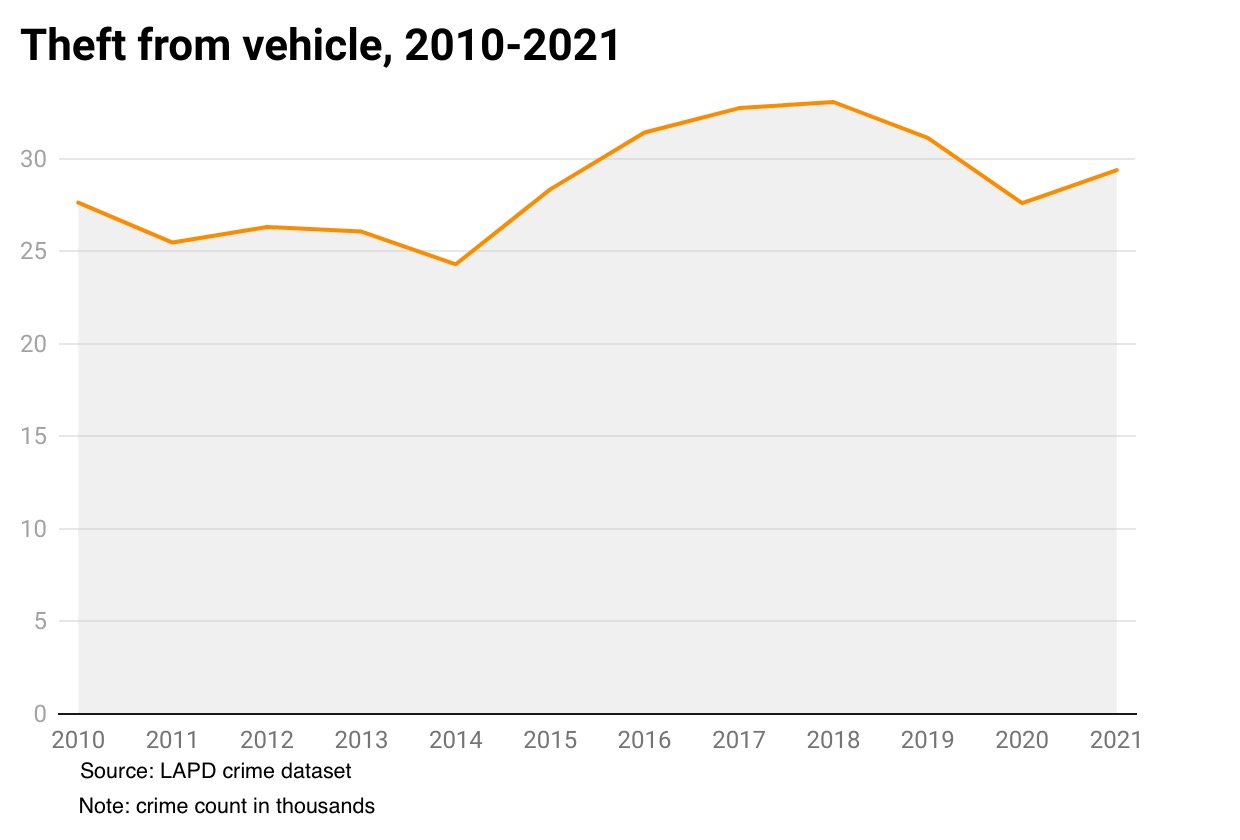
Stealing from your car
Breaking into a car and stealing something is the most common crime in Los Angeles. Last year there were 29,373 reports of breaking into a vehicle, or about 80 a day. But that was down 5.6% from 2019. (It rose slightly compared with 2020.)
How we did it: We examined publicly available crime data from the Los Angeles Police Department, as well as LAPD Compstat data. Learn more about our data here.
LAPD data only reflects crimes that are reported to the department, not how many crimes actually occurred. In making our calculations, we rely on the data the LAPD makes publicly available. LAPD may update past crime reports with new information, or recategorize past reports. Those revised reports do not always automatically become part of the public database.
Want to know how your neighborhood fares? Or simply just interested in our data? Email us at askus@xtown.la.


