

The Crosstown Crime Book: March


A lot of news stories mention crime statistics in Los Angeles, and sometimes the data is used to foment a sense of alarm. But numbers only go so far: What one needs is context, and a sense of how the current figures compare with past periods.
That’s where the Crosstown Crime Book comes in. Each month, we dig through publicly available Los Angeles Police Department data to detail where crime stands both in relation to recent months, and to the same month in previous years. Here is how the numbers looked in March.
Firing shots
The past year has brought a lot of headlines and hand-wringing over gun violence. Police Chief Michel Moore has repeatedly pointed to a rise in firearms used during robberies. Indeed, the 207 robberies in which a gun was utilized last month was the highest number since the LAPD began making its data available in 2010. It is 58% higher than the number of incidents during the same month last year.
In March, the LAPD recorded 281 reports of shots fired. Although that is 10.2% higher than the same month last year, it is not far removed from any of the previous six months.
Gunshots were heard most frequently in Downtown last month, with 18 reports. There were another 16 reports in Boyle Heights and 11 in Pico-Union.
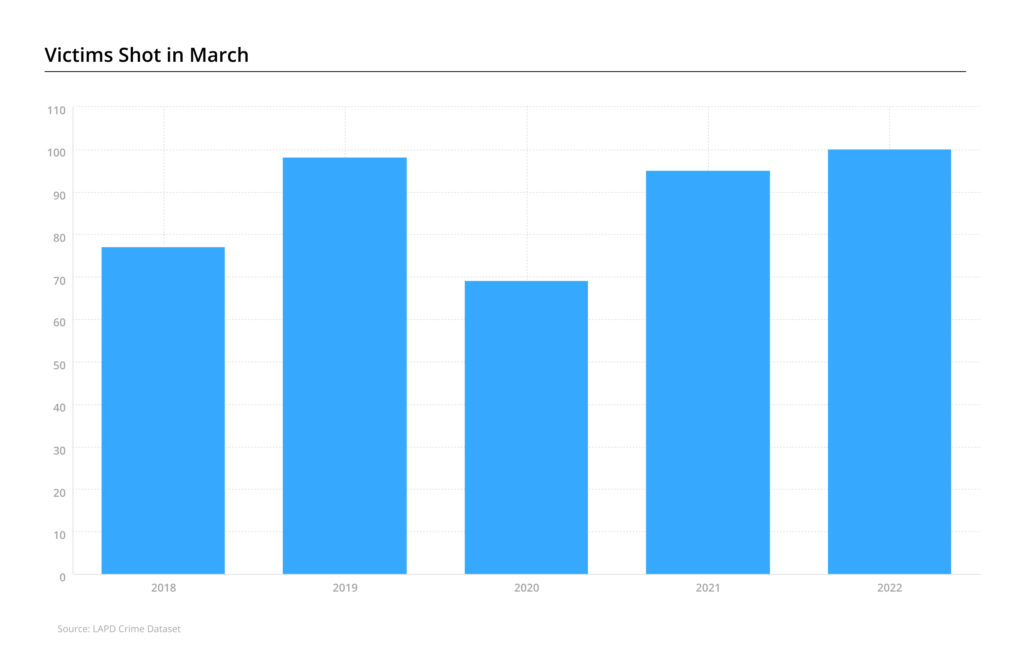
There were 100 people shot in the city in March. That is lower than any time in the past six months, and far below the 140 victims struck by gunfire last August. However, it is more than any other March since 2018.
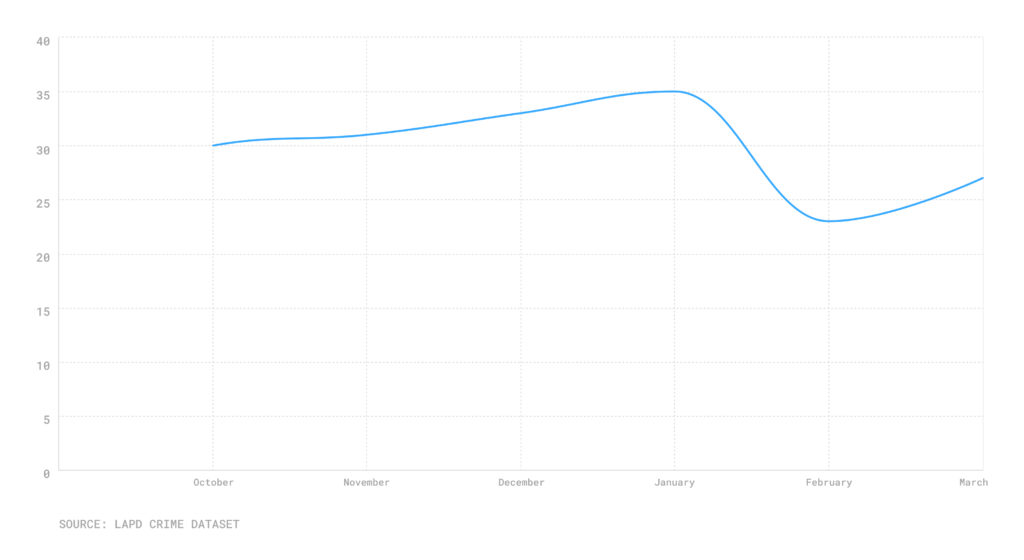
The vast majority of homicides in the city involve guns. In March, there were 27 murders in Los Angeles. Although that is an increase from the 23 in February, it is fewer than in any month from June 2021-January 2022.
Homicides in Los Angeles, October 2021-March 2022
Things gone missing
The coronavirus pandemic hit Los Angeles in March 2020, and almost immediately car thefts increased. While life in the city has returned to something resembling normal, the number of stolen vehicles has only increased. Police have said older models with weak security systems are often targeted, though on some occasions car owners have left key fobs in cup holders, making pickings easy for thieves.
[Get COVID-19, crime and other stats about where you live with the Crosstown Neighborhood Newsletter]
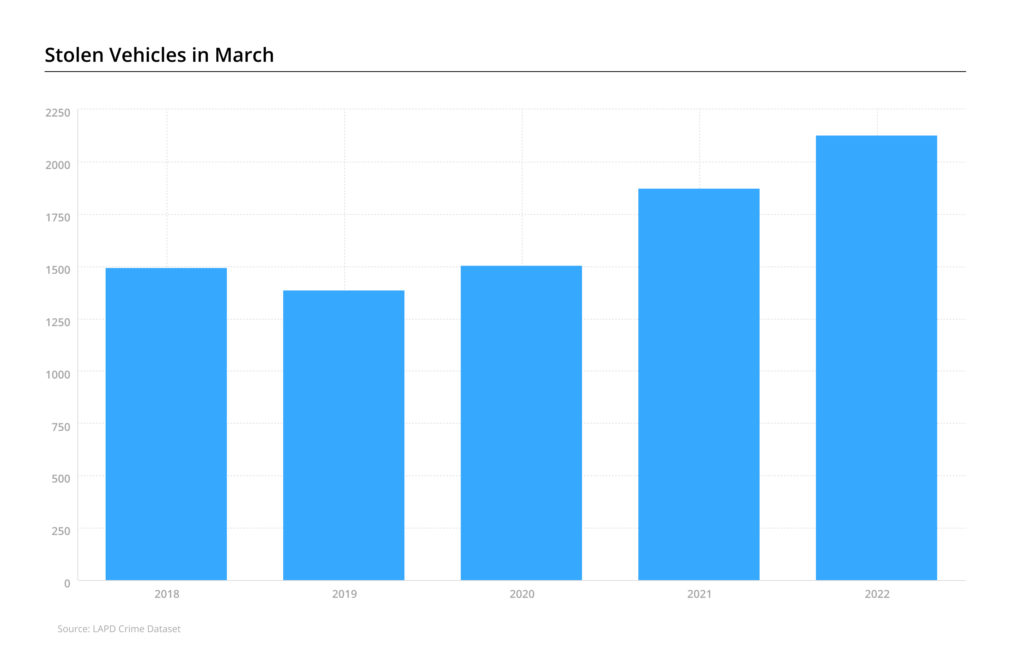
In March, the LAPD fielded reports of 2,124 stolen vehicles. That is down from the levels reached in the final months of last year—including the record 2,388 cars that went missing in October—but far above numbers before COVID-19. During March in the pre-pandemic year of 2019, a total of 1,385 cars were stolen.
Auto thieves struck in Downtown 97 times last month, more than any other neighborhood in Los Angeles. Another 78 vehicles were swiped in Westlake.
In 2021, burglaries in the city hit their lowest annual total in more than a decade. However, numbers have stopped falling, and instead have remained essentially flat over the last six months. There were 1,133 burglaries reported in March, barely a change from the 1,115 last month and the 1,151 in October.
How we did it: We examined publicly available crime data from the Los Angeles Police Department from Oct. 1, 2021-March 31, 2022, and the periods of March 1-31 from 2018-2022. Learn more about our data here.
LAPD data only reflects crimes that are reported to the department, not how many crimes actually occurred. In making our calculations, we rely on the data the LAPD makes publicly available. LAPD may update past crime reports with new information, or recategorize past reports. Those revised reports do not always automatically become part of the public database.
Have questions about our data or want to know more? Write to us at askus@xtown.la.


