

The Crosstown Crime Book: February


Crime continues to be a front-burner issue in Los Angeles. But to truly understand the state of public safety, one needs to know not just the number of criminal acts, but the context in which they occur.
That’s where the Crosstown Crime Book comes in. Each month, we examine publicly available Los Angeles Police Department data and detail where crime stands both in relation to recent months, and to the same month in previous years. Here is how Los Angeles fared in February, the shortest month of the year.
A firearms epidemic
A slate of high-profile robberies late last year put many people on edge, and the LAPD focused special attention on “follow home” incidents in which victims were targeted after leaving nightclubs, restaurants or stores. In actuality, the monthly tally of robberies has been fairly flat since October, and the 752 incidents in the city in February is above the 675 in the same month last year, but on par with the 720 recorded in both February 2019 and 2020.
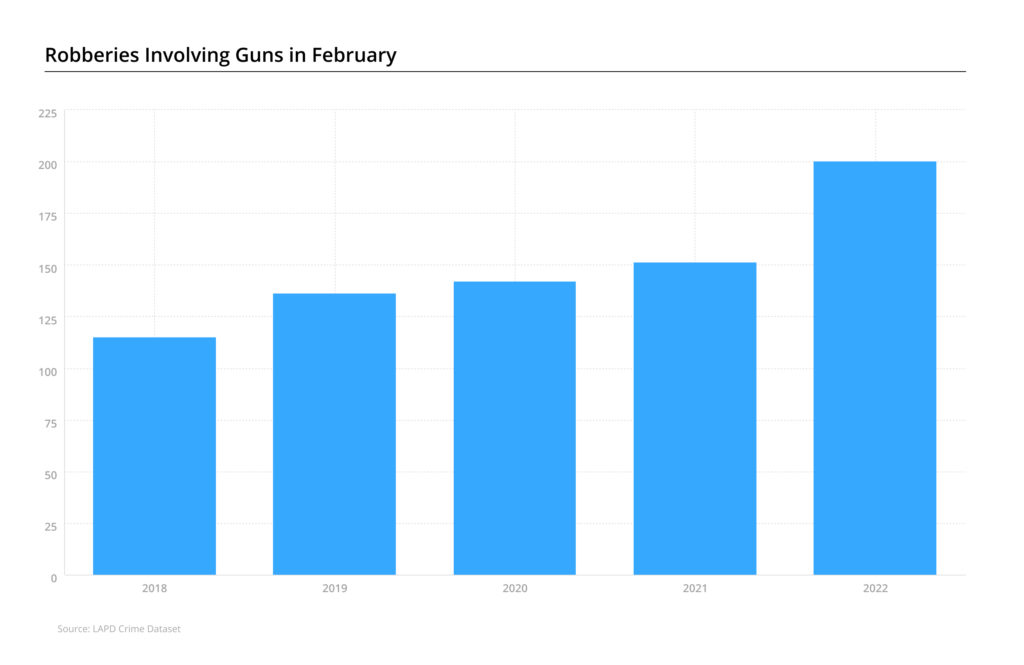
Where the situation changes is robberies involving firearms. Police Chief Michel Moore recently said that criminals are increasingly using “ghost guns,” untraceable weapons which are sometimes manufactured on a 3D printer. Seventh District Councilmember Monica Rodriguez, who chairs the City Council’s Public Safety Committee, echoed the sentiment Wednesday at a Downtown luncheon hosted by the Los Angeles Current Affairs Forum, stating, “We’ve got ghost guns on the street that are prevalent.”
According to LAPD data, a firearm was wielded in 200 robberies in February. That is a 32.4% jump from the same month last year. In February 2018, there were 115 robberies involving a gun.
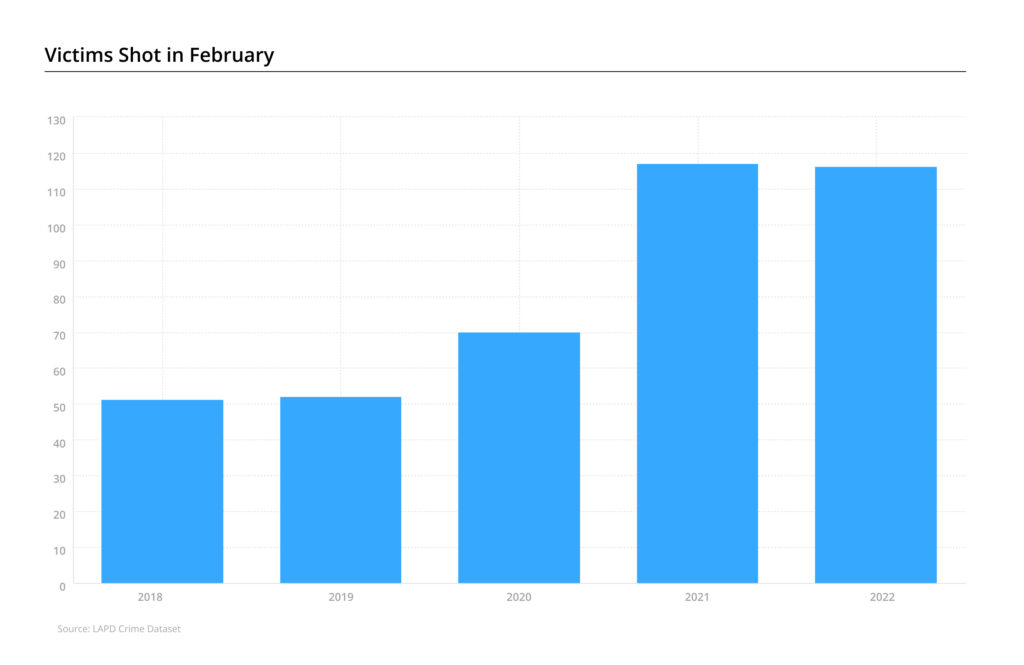
Gun use has soared in metropolitan areas across the country since the onset of the pandemic, and cities such as Chicago have seen far more bloodshed than Los Angeles. Yet that does not make the local situation any easier to accept. There were 116 people shot in the city in February. Although that is consistent with monthly figures since September, and nearly identical to the number last February, it marks a 127% increase over the total in the same month in 2018.
The community with the highest number of victims shot last month was Downtown, with eight. Six people were hit by gunfire in Westlake.
The LAPD fielded 242 shots-fired reports in February. That is below the 257 in the same month last year. But again, it is far above pre-pandemic tallies. In February 2018 the LAPD recorded 120 reports of shots fired.
[Get COVID-19, crime and other stats about where you live with the Crosstown Neighborhood Newsletter]
One positive trend is a decrease in homicides, particularly after the city in 2021 experienced its highest number of murders since 2007. There were 22 killings last month. That is fewer than the 27 in February 2021, as well as the lowest figure in 10 months.
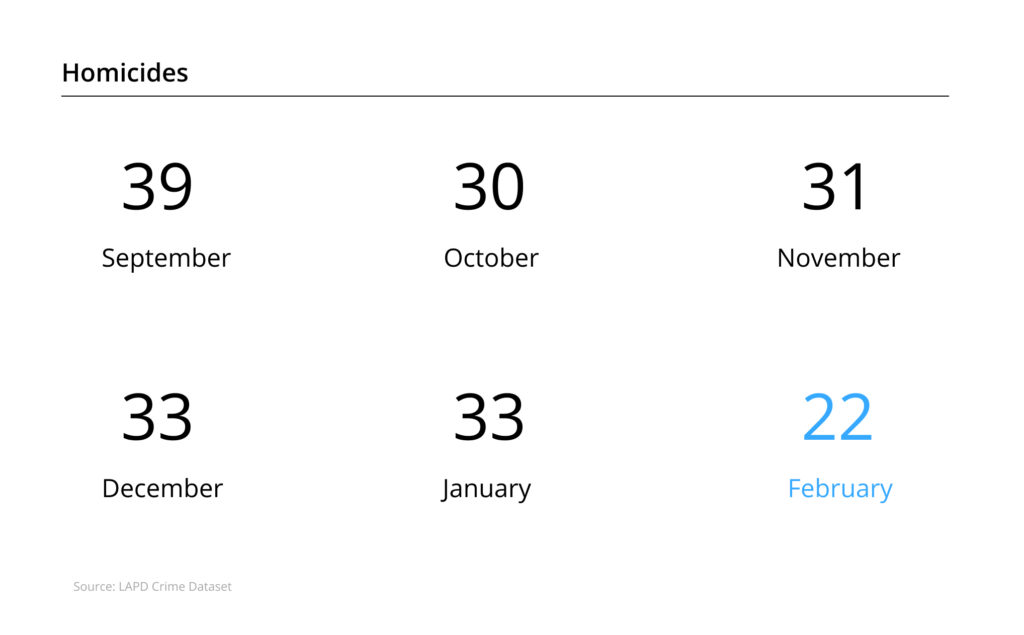
At the March 1 meeting of the Los Angeles Police Commission, Moore said the decline stems from a reduction in murders involving gangs and people experiencing homelessness.
World of wheels
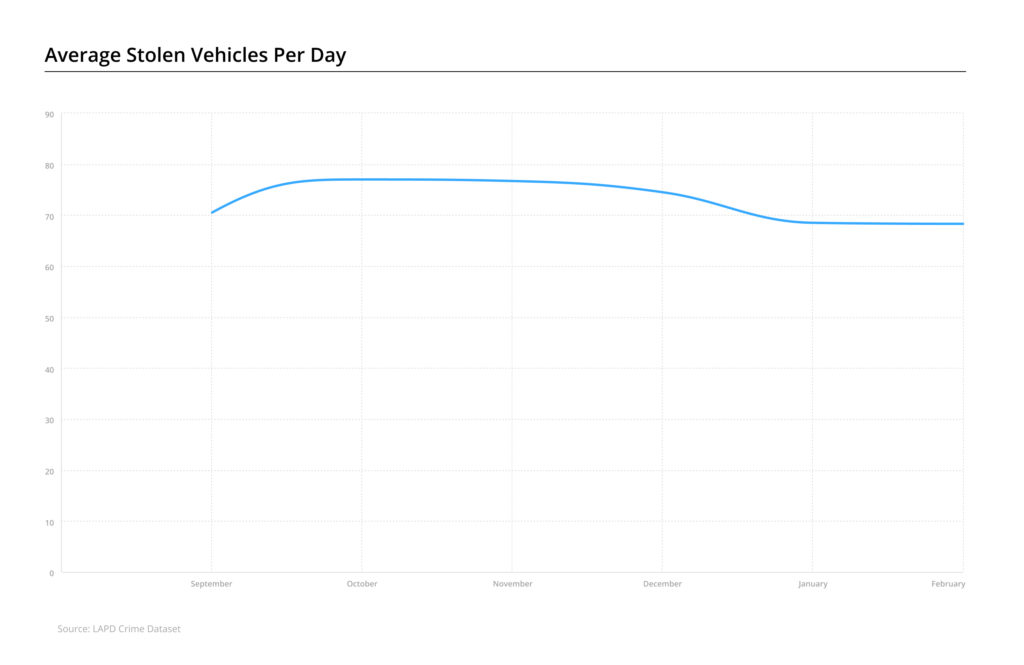
After car thefts spiked in the final quarter of 2021, the number of stolen vehicles decreased in February, and not only because the month has just 28 days. There were an average of 68.3 cars taken each day during the month. That is equivalent with January, and about nine fewer than the average of 77 cars stolen each day in October.
Downtown again saw more stolen cars than any other community, with 89 taken in February. Sixty-six vehicles went missing in Koreatown and 61 in Boyle Heights.
The number of vehicle break-ins during February also declined, both in comparison with recent months, and when compared with the same month before the pandemic. There were 2,319 reports of burglary or theft from a vehicle in Los Angeles in February. That is a decline of 10.5% from the almost 2,600 BTFVs in February 2018.
Los Angeles saw 1,082 burglaries last month, which is slightly higher than the total in the same month the previous year, but below the 1,220 burglaries in February 2018. The most-victimized community last month was Downtown, with 92 burglaries. There were 46 incidents in Sherman Oaks and 40 in Van Nuys.
How we did it: We examined publicly available crime data from the Los Angeles Police Department from Sept. 1, 2021-Feb. 28, 2022, and the periods of Feb. 1-28 from 2018-2022. Learn more about our data here.
LAPD data only reflects crimes that are reported to the department, not how many crimes actually occurred. In making our calculations, we rely on the data the LAPD makes publicly available. LAPD may update past crime reports with new information, or recategorize past reports. Those revised reports do not always automatically become part of the public database.
Have questions about our data or want to know more? Write to us at askus@xtown.la.


