

Los Angeles sees slight increase in COVID counts


In recent weeks, a number of Angelenos have experienced something unexpected and distressing: two lines on a COVID-19 test. Yes, the coronavirus is still a thing, and people continue to get sick.
Although the summer of 2023 has not produced the kind of spike in cases that was seen in previous years, there are indications that more individuals are getting infected. That includes the scientific: statistics from the Los Angeles County Department of Public Health; as well as the anecdotal: social media posts about positive tests imperiling summer vacations.
Could the trend continue? Perhaps. Almost no one masks up these days, and there are concerns that (requisite pop culture reference coming) those massive Taylor Swift concerts at SoFi Stadium could drive caseloads higher.
[Get crime, housing and other stats about where you live with the Crosstown Neighborhood Newsletter]
To be sure, official numbers are historically low. They are also highly unreliable, because many people who test positive at home and have mild or no symptoms never report their status to health officials. Still, the weekly tally compiled by the Department of Public Health functions as a barometer, and counts are rising modestly.
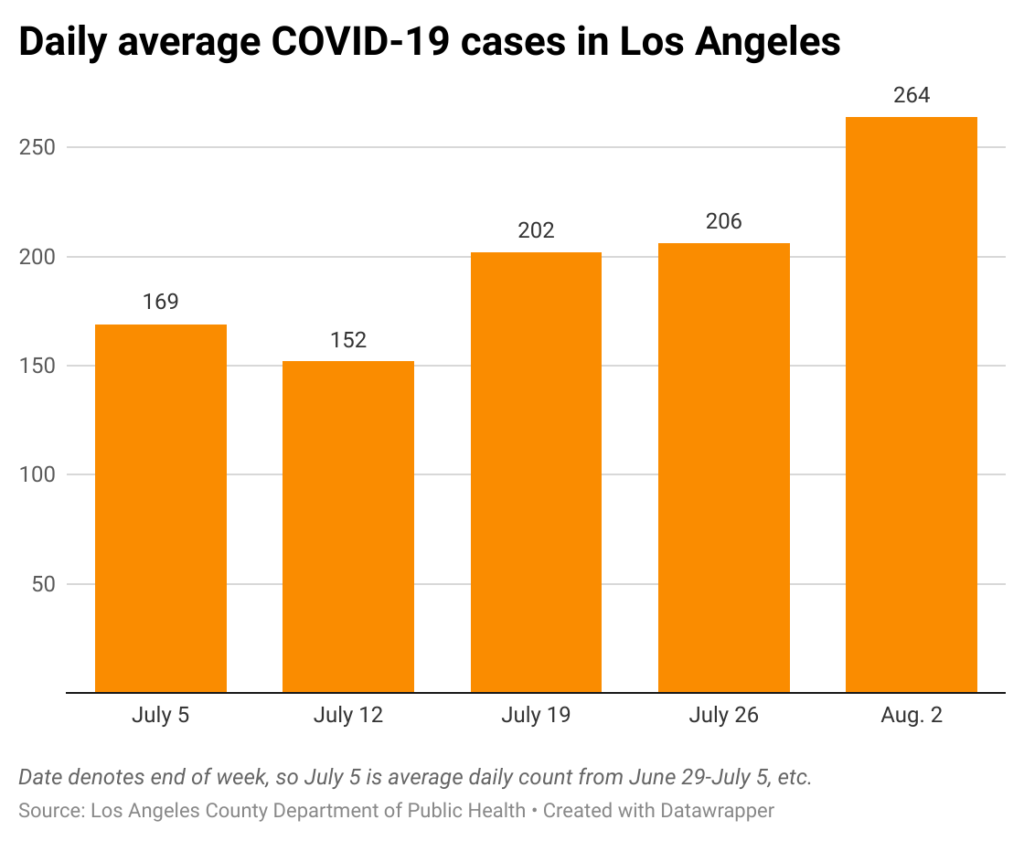
In the seven-day period ending Aug. 2, there were an average of 264 daily confirmed cases in the region, according to the Department of Public Health (the department recently switched from a weekly total to issuing an average). Three weeks prior, the average was 152 cases.
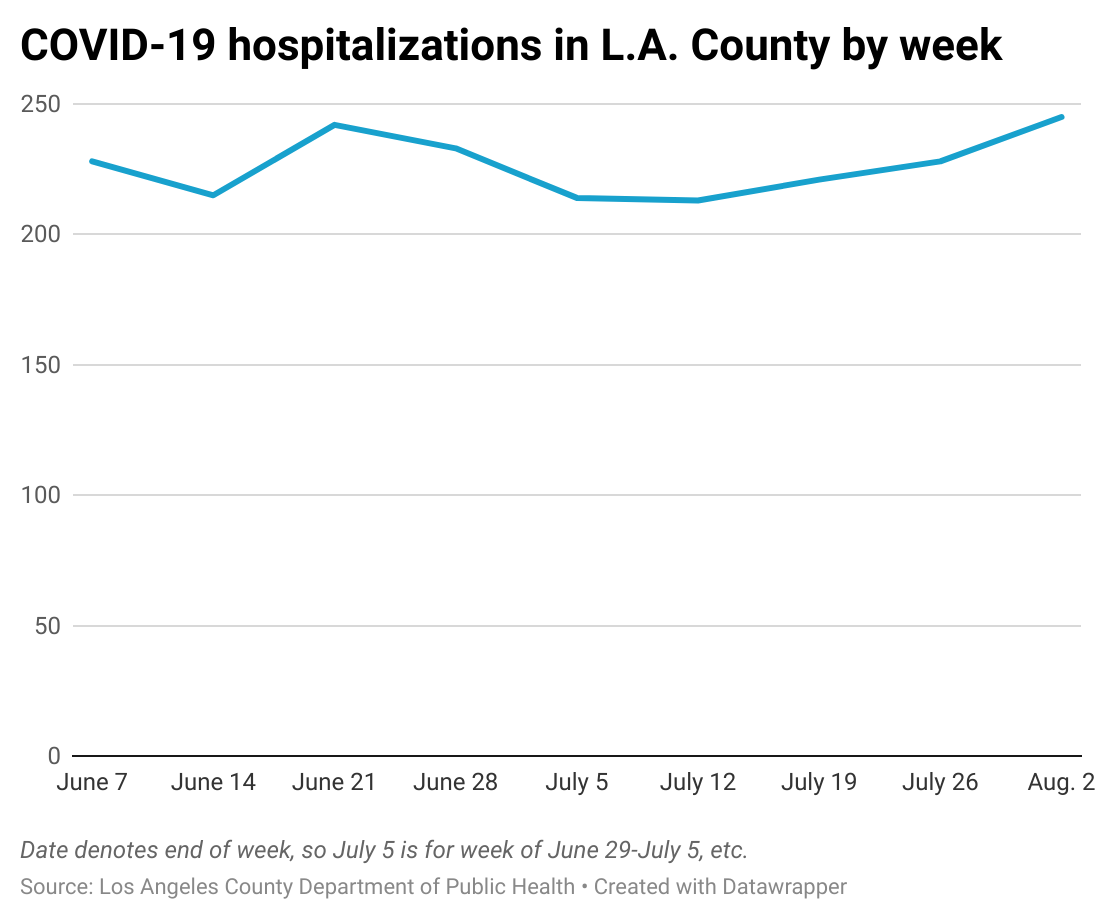
There has also been a small rise in hospitalizations. In the week ending Aug. 2, there were 245 people with COVID-19 in area medical institutions. That is up 7.5% from the previous week.
It is important to put the figures in context. The COVID-19 hospitalization count one year ago was more than five times this week’s total. The count was even higher in our first COVID summer, before vaccinations were available.
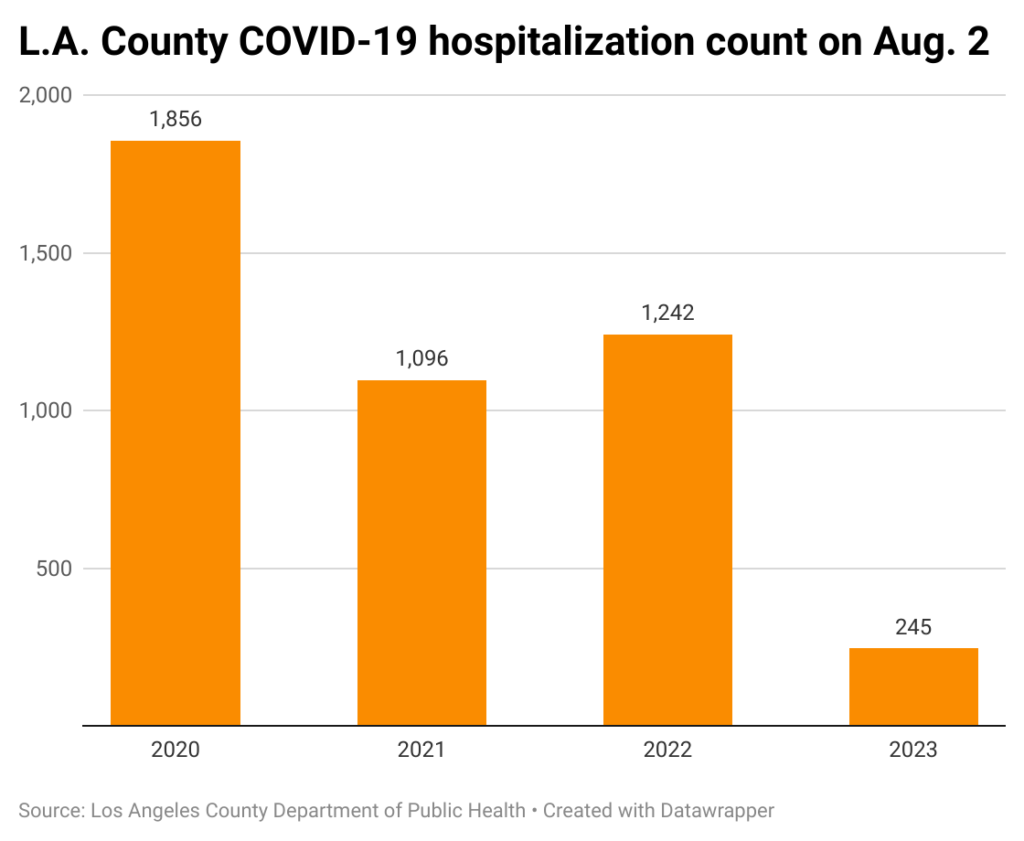
At the worst point of the pandemic, in early 2021, more than 8,000 people in the county were hospitalized with COVID-19.
Vaccination impact
Since vaccines became available, a total of 21.8 million shots have gone into arms in Los Angeles County, according to a Department of Public Health dashboard. That includes 19.9 million of what is termed the “original dose,” and 1.9 million “updated” doses.
Department data shows that an estimated 81% of county residents have received at least one dose. About 1.9 million people in the region, or 18%, are considered up to date on their vaccinations.
Even for those not up to date, previous infections and earlier vaccinations are believed to provide some protection against the most severe impacts of a COVID-19 infection.
How we did it: We analyzed coronavirus data related to new cases, deaths, hospitalizations and vaccinations provided by the Los Angeles County Department of Public Health.
Learn more about our data here. Any questions? Email askus@xtown.la.


